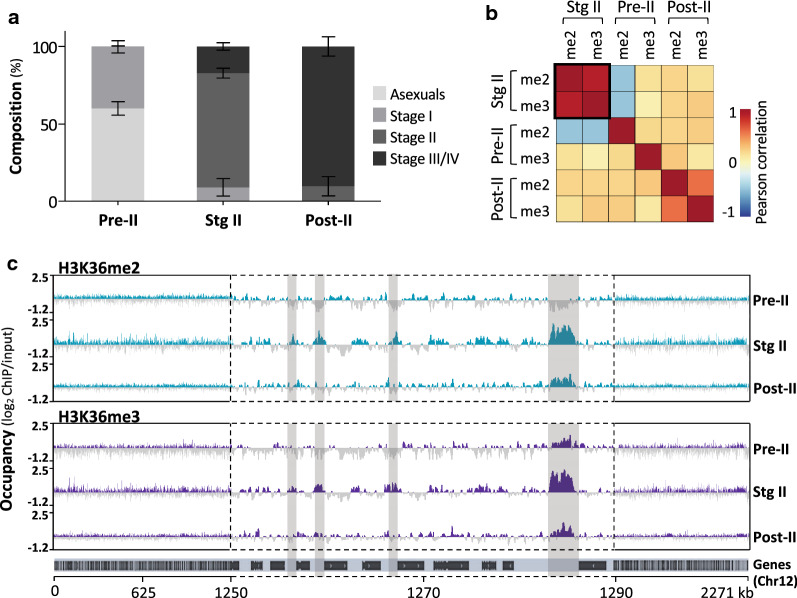
Fig. 1.
H3K36me2&3 have dynamic patterns of occupancy during P. falciparum early and intermediate gametocyte development. a The stage compositions (%) of gametocyte populations used for the ChIP-seq study, classified as pre-stage II (pre-II), stage II (stg II) and post-stage II (post-II) as determined microscopically. Data are from two independent biological repeats, ± S.E. b Plot of Pearson correlation coefficients for the genome-wide occupancy of H3K36me2&3 (me2 and me3) obtained for each gametocyte population with data representing two independent biological repeats. The black box highlights the increased positive correlation between H3K36me2&3 in stage II gametocytes. c H3K36me2&3 occupancy (average log2-transformed ChIP/input) over chromosome 12 for each gametocyte population. Data are representative of two independent biological replicates except for the pre-II gametocytes with a single replicate. Turquoise and purple represent regions where the hPTMs are present (log2ChIP/input ratios > 0) and dark grey represents regions of depletion (log2ChIP/input ratios ≤ 0). The light grey shadowed areas highlight stage II gametocyte-specific sites of H3K36me2&3 enrichment exemplified in a central region of the chromosome 12 (1250–1290 kb) with the positions of genes indicated below the occupancy tracks

