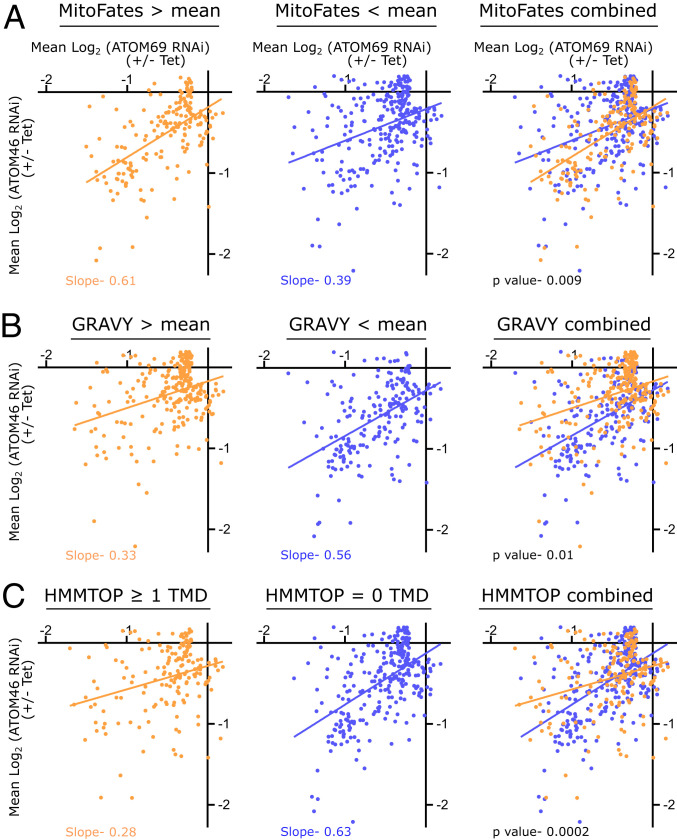
Fig. 3.
Receptor preference correlates with physicochemical features of the substrates. (A) Mitochondrial presequence prediction values for 454 mitochondrial proteins that were down-regulated (greater than 0.15 fold, −0.2 log2) in at least one of the two RNAi cell lines were determined using MitoFates. The mean of these values was calculated, and the dataset was divided into two groups: proteins with a predicted presequence value above (orange) or below (blue) the mean. Linear regressions of both groups are indicated by the orange and blue lines, respectively. (B) As in A, but GRAVY scores are analyzed. Proteins with a GRAVY score above the mean are indicated in orange, whereas proteins below the mean are depicted in blue. (C) As in A and B, but proteins were analyzed for predicted TMDs using HMMTOP. The dataset was divided into orange (≥1 TMDs) and blue (0 TMD) proteins. Slopes for regression lines and P value are indicated.

