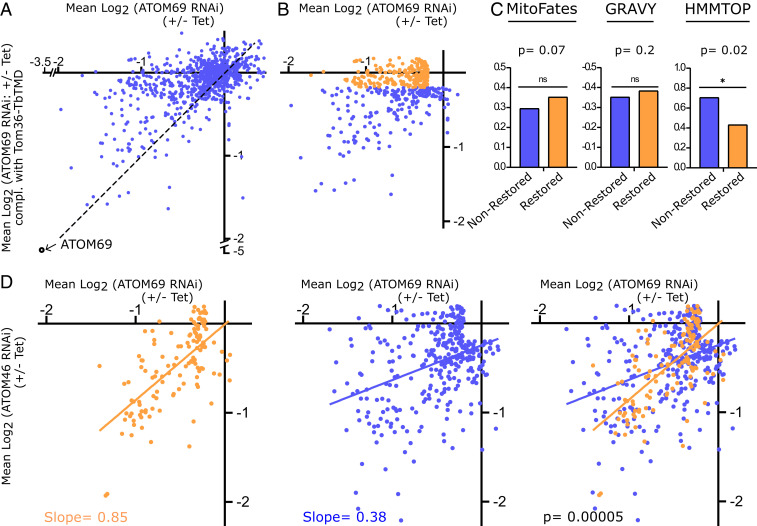
Fig. 5.
Tom36 restores import of a subpopulation of proteins. (A) Scatter plot depicting fold change in abundance of 895 mitochondrial proteins upon ablation of ATOM69 (x-axis) and after ATOM69 has been replaced by Tom36-TbTMD (y-axis). (B) Orange dots depict the 222 proteins, the import of which is efficiently restored, with a down-regulation between +0.2 and −0.2 log2. Blue dots depict the remaining 211 proteins, the import of which is not efficiently restored. For both groups, 115 significantly up-regulated proteins whose levels were above 0.2 log2 and 346 proteins whose levels changed less than ±0.2 log2 in both the ATOM69 RNAi as well as the Tom36 complemented cell lines were subtracted. (C) Comparison of the mean of MitoFates, GRAVY index, and TMD predictions between nonrestored and restored groups. (D) The 127 restored proteins that are also detected in the receptor preference dataset of Fig. 3 are highlighted in orange. Orange and blue lines show the linear regressions of the 127 detected restored (orange) and the 327 remaining proteins (blue). Slopes for regression lines and P values are indicated.

