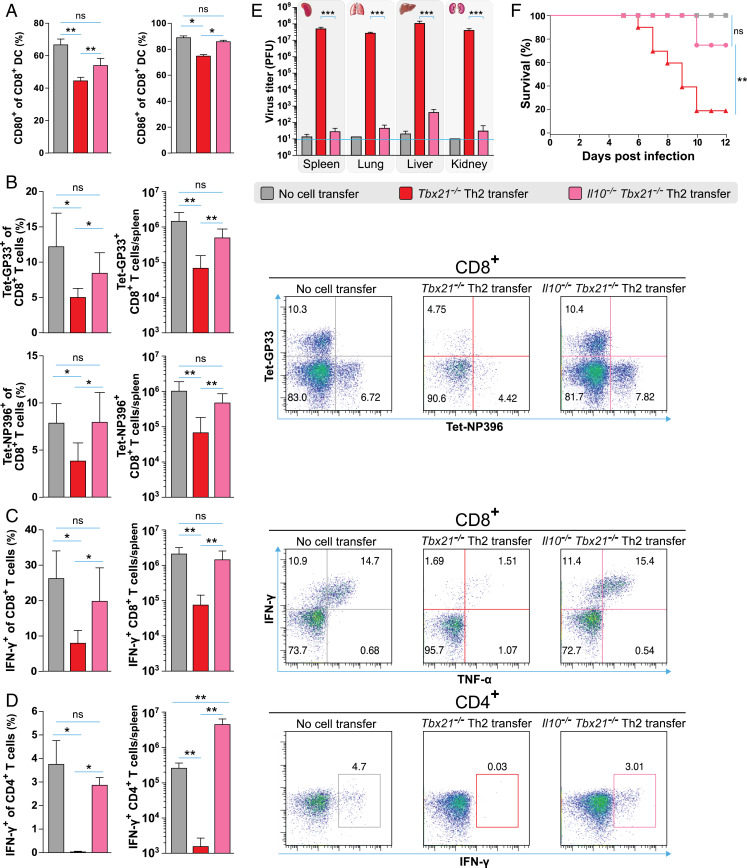
Fig. 7.
Tbx21−/− Th2 cells impair the activation of DCs and T cells via IL-10 in vivo. (A) Frequencies of CD80 and CD86 expression on CD8+CD11c+ DCs in the spleen of Tbx21−/− Th2 and Il10−/−Tbx21−/− Th2 cell recipients and nontransferred control mice at day 3 postinfection. (B) Frequencies and absolute cell numbers (Left) as well as representative fluorescence-activated cell sorting (FACS) plots (Right) of GP33- and NP396-tetramer+ CD8+ T cells in the spleen of Tbx21−/− Th2 and Il10−/−Tbx21−/− Th2 cell recipients and nontransferred control mice at day 8 postinfection. (C) Frequencies and absolute cell numbers of IFN-γ–producing CD8+ T and (D) CD4+ T cells in the spleen of Tbx21−/− Th2 and Il10−/−Tbx21−/− Th2 cell recipients and nontransferred control mice at day 8 postinfection after restimulation ex vivo with GP33 or GP64 peptides, respectively (Left). Representative FACS plots of C and D (Right). (E) LCMV titers in various organs of Tbx21−/− Th2 and Il10−/−Tbx21−/− Th2 cell recipients and nontransferred control mice at day 8 postinfection as determined by plaque assay. (F) Survival plots of Tbx21−/− Th2 and Il10−/−Tbx21−/− Th2 cell recipients and nontransferred control mice until day 12 postinfection. The log-rank test was used for statistical evaluation of survival (Kaplan–Meier survival curves). All experiments were performed at least twice, and each experimental group included n ≥ 3. Data are representative and expressed as mean ± SEM. Asterisks indicate statistically significant differences as analyzed by one-way ANOVA with Bonferroni’s post test (A–E) (*P < 0.05, **P < 0.01, ***P < 0.001).

