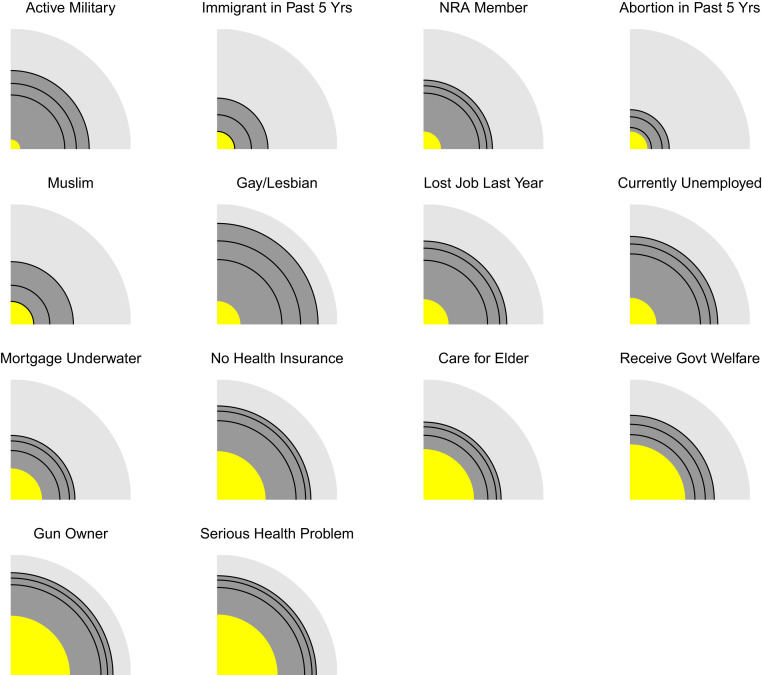
Fig. 2.
Core groups and penumbra size. Groups asked about in our survey in increasing order of size. For each group, the area of the yellow circle indicates its size, and the concentric circles show its estimated penumbra: the percentage of survey respondents who report knowing at least one family member, close friend, or other acquaintance in the group. The light gray concentric circle denotes the rest of the US population that is not in the group’s penumbra.

