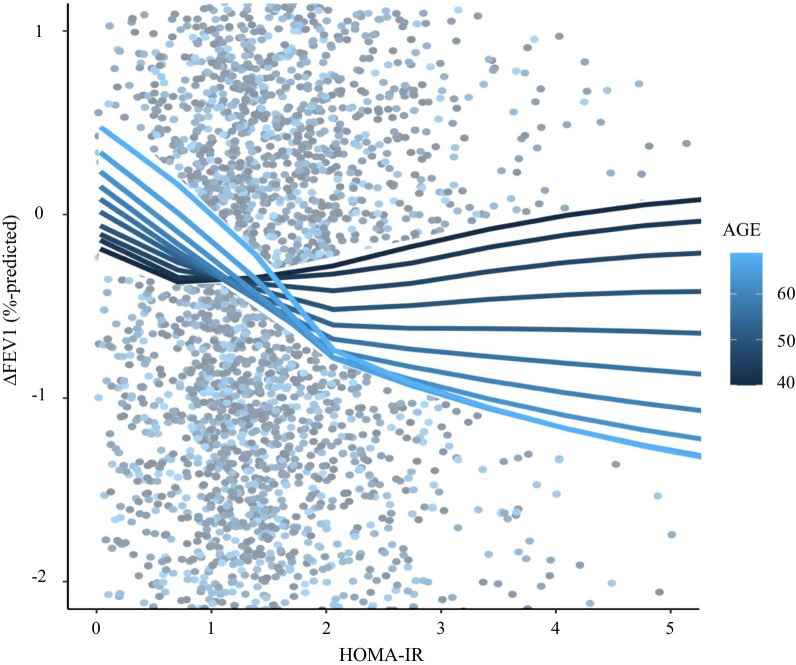
Fig. 5.
LOWESS regression plot with interaction for the effect modification of age on the association between HOMA-IR and annual change in FEV1%-predicted. Solid lines represented the univariate LOWESS regression curves modulated by age. The darkest blue, and lightest blue lines represented lines of mean minus one SD (44 years) and plus one SD (62 years). Abbreviations: LOWESS, locally weighted scatter-plot smoothing; HOMA-IR, homeostatic model assessment-insulin resistance; FEV1, forced expiratory volume in 1 s; SD, standard deviation

