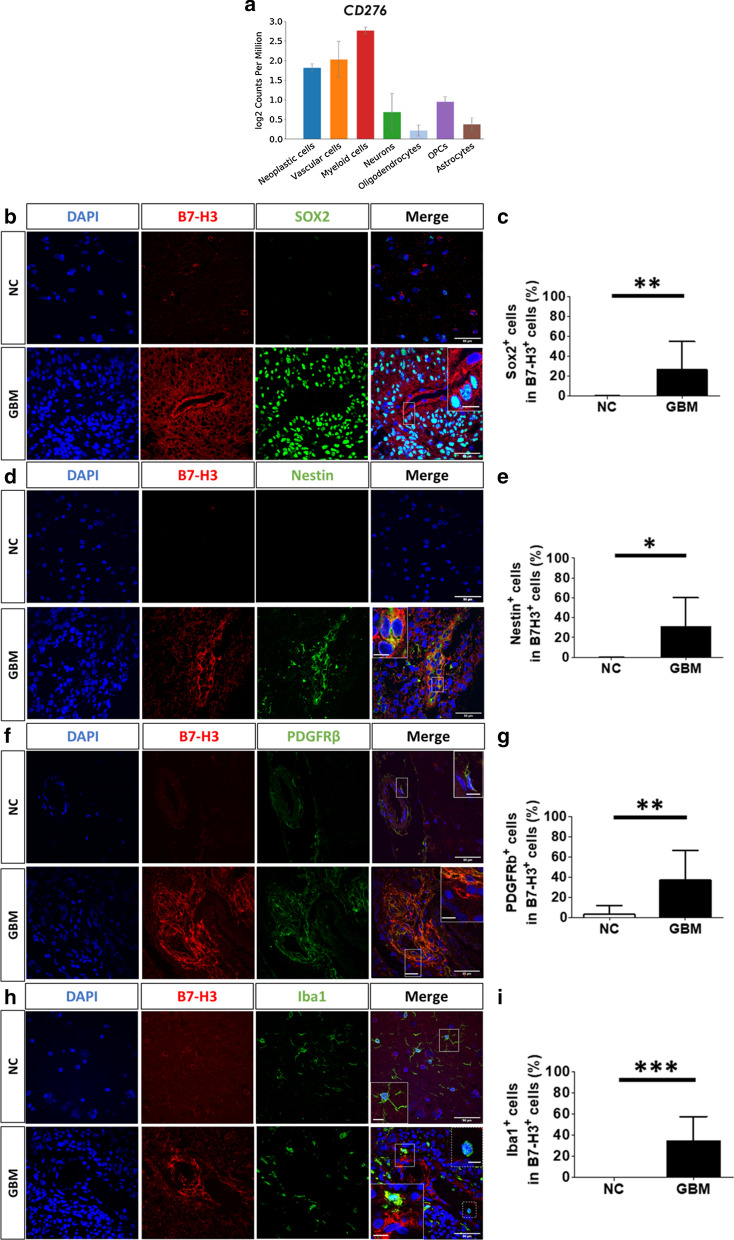
Fig. 2.
B7-H3 is mainly expressed by neoplastic cells, pericytes and myeloid cells. a CD276 gene expression profiles in different cell types using data generated by Darmanis et al. (2017). b, d, f, and h Representative images of B7-H3 (red) co-labeled with (b) SOX2 (d) Nestin (f) PDGFRβ and (h) Iba1 (green) in non-cancerous (NC) brain (N = 5) versus GBM (N = 6) tissues. DAPI (blue) was used to counterstain nuclei. Major scale bar = 50 µm and scale bar for enlarged images = 10 µm. c, e, g and i Percentage of B7-H3 positive cells expressing SOX2, Nestin, PDGFRβ and Iba1 in NC brain (N = 5) versus GBM (N = 6) tissues. Graphs are mean ± SD *p < 0.05 **p < 0.01 and ***p < 0.001 (t-test)

