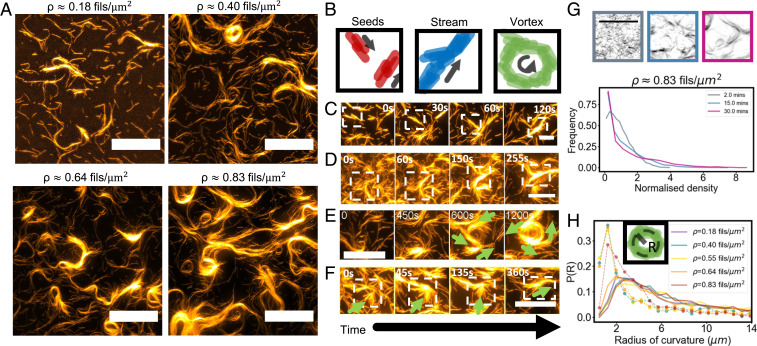
Fig. 2.
Formation of streams and vortices at different surface densities. (A) Structures forming at different surface densities ρ of filaments. (Scale bars, 20 μm.) (B) Schematic representations of seeds composed of a few filaments, of an elongated stream composed of several filaments, and of a vortex. (C–E) Close-up of different structures forming. Seeds can merge together (C, ρ ∼0.4 filaments/μm2), and the merging of seeds can result in stream formation (D, ρ ∼0.83 filaments/μm2) or vortex formation (E, ρ ∼0.64 filaments/μm2). Green arrows indicate the local direction of motion. (F) Filaments and seeds stop against a transient obstacle for about 2 min, and additional filaments with the same orientation further accumulate in place. As the obstacle glides away, a thicker stream has formed composed of filaments moving in the same direction (Scale bars in C–F, 10 μm.) (G) Snapshots of the system at ρ ∼0.83 filaments/μm2 for different times and corresponding density histogram showing cluster formation over time. A normalized density of one indicates the isotropic phase. (Scale bar, 10 μm.) (H) Histogram of the local radius of curvature R of streams (solid lines) and vortices (dashed lines with circles) at different densities. The Inset shows a schematic of the radius of curvature for a vortex.

