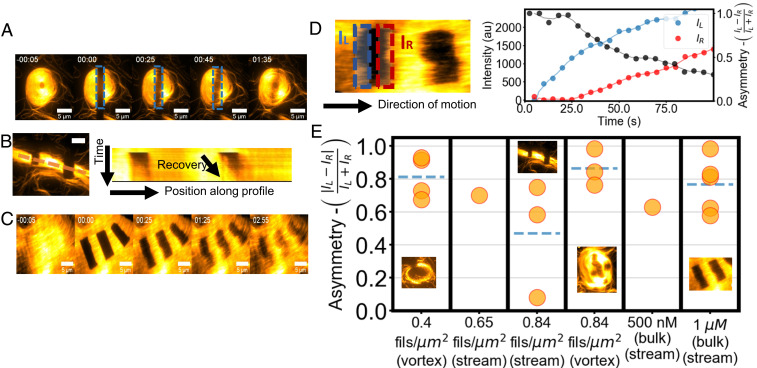
Fig. 4.
FRAP experiments reveal the polarity of streams and vortices. (A) Example of bleaching and recovery of a vortex at ρ ∼ 0.83 filaments/μm2. Time 0 is right after bleaching. (B) Bleaching and kymograph of recovery along the dashed line for a stream at ρ ∼0.83 filaments/μm2. Total time is 100 s. (C) Bleaching and recovery of a stream at 1 μm actin. Time 0 is right after bleaching. (Scale bars in A–C, 10 μm.) (D) Schematics and example of the polarity measurement. Two opposite regions of the bleached area along the filaments’ direction of motion are recorded independently over time (red and blue curves) to compute the polarity parameter P (black curve). The lag in the recovery of the red region indicates polar motion. (E) Plot of the polarity parameter for different structures at different densities, showing recovery starting from one side. Streams and vortices are analyzed separately. Dashed lines indicate a mean value. The Inset shows examples of the FRAP experiments.

