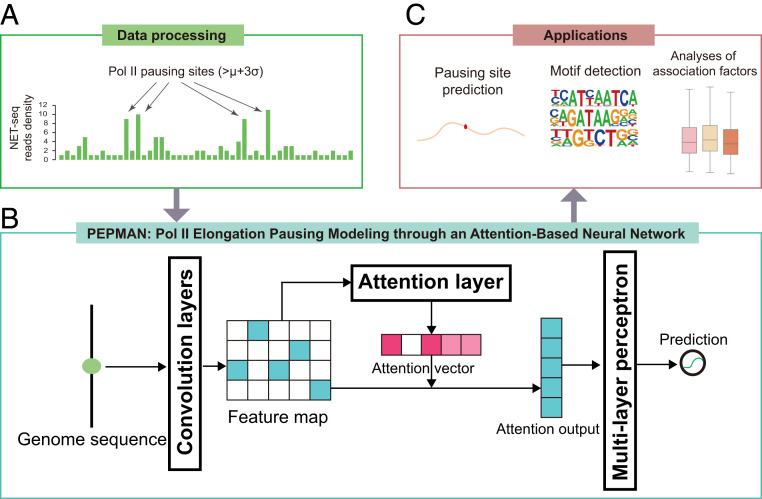
Fig. 1.
Schematic overview of the PEPMAN pipeline. (A) Data preprocessing. The NET-seq read counts that are larger than three standard deviations above the mean are defined as Pol II pausing sites. (B) The PEPMAN architecture. The contextual sequence surrounding a target site is first one-hot encoded and then passed through a two-layer CNN. The encoded feature map is then fed into an attention layer to calculate the attention vector, which stores the importance scores of individual nucleotide positions to the final prediction. Next, the attention vector is combined with the original feature map and then passed into an MLP to predict the pausing probability of the input target site. (C) Downstream applications of PEPMAN. The text has more details.

