Fig. 2.
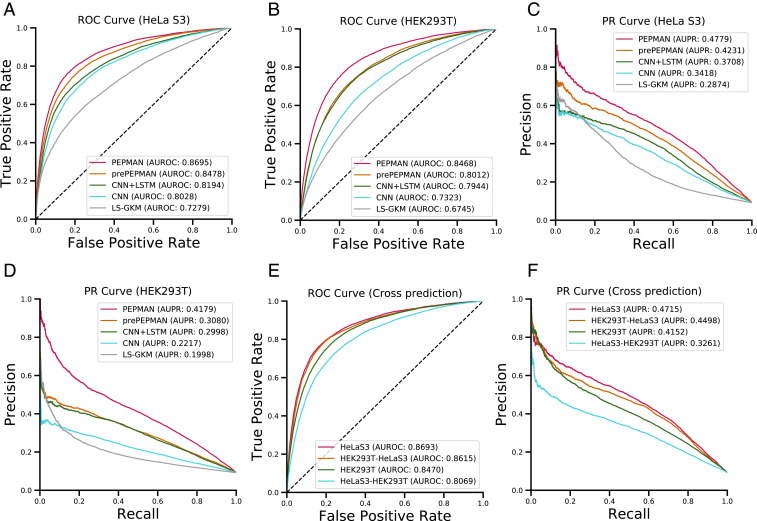
Performance evaluation of PEPMAN on the test data (chromosomes 17 to 22 and X; the ratio of positive to negative samples was 1:10). (A and B) Receiver-operating characteristic (ROC) curves and corresponding area under receiver-operating characteristic curve (AUROC) scores of PEPMAN and different baselines in HeLa S3 and HEK293T cell line, respectively. (C and D) Precision recall (PR) curves and the corresponding area under precision recall (AUPR) scores of PEPMAN and different baselines in HeLa S3 and HEK293T cell lines, respectively. Pre-PEPMAN denotes the PEPMAN model without attention mechanism, CNN + LSTM denotes a reimplementation of DanQ (27), CNN denotes a reimplementation of DeepBind (22), and LS-GKM stands for a conventional SVM-based method (25). (E and F) ROC curves/AUROC scores and PR curves/AUPR scores of cross-cell line prediction of different models between HEK293T and HeLa S3 cells, respectively. HeLa S3 and HEK293T denote the performance of PEPMAN on the original test datasets. HEK293T–HeLa S3 and HeLa S3–HEK293T denote the cross-cell line performance of the models that were trained on data from the former and tested on data from the latter. Detailed AUROC and AUPR scores of PEPMAN and baselines in HeLa S3 and HEK293T cell lines over 10 repeats are shown in SI Appendix, Table S1.

