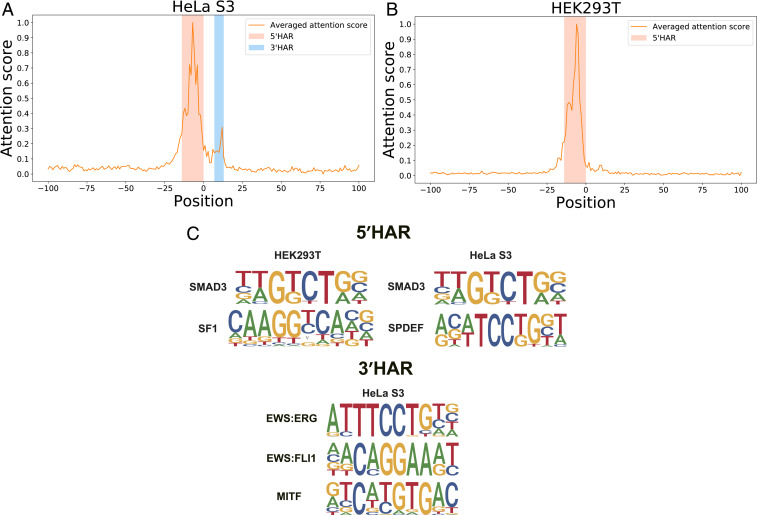
Fig. 3.
The high-attention regions (HARs) indicating the important contextual sequence features in predicting Pol II pausing events. (A and B) The distributions of attention scores of the contextual sequences over all samples in the test data in HeLa S3 and HEK293T cell lines, respectively. For the HeLa S3 cell line (A), two HARs were highlighted (one on the 5′-end direction, denoted by 5′HAR, and the other on the 3′-end direction, denoted by 3′HAR), while for the HEK293T cell line (B), only one HAR (i.e., 5′ HAR) was highlighted. (C) The known sequence motifs from the database TRANSFAC (28) enriched in the 5′HARs of HeLa S3 and HEK293T cell lines and the 3′HAR of the HeLa S3 cell line, which were determined by the motif-calling program HOMER (29), with Benjamini q values .

