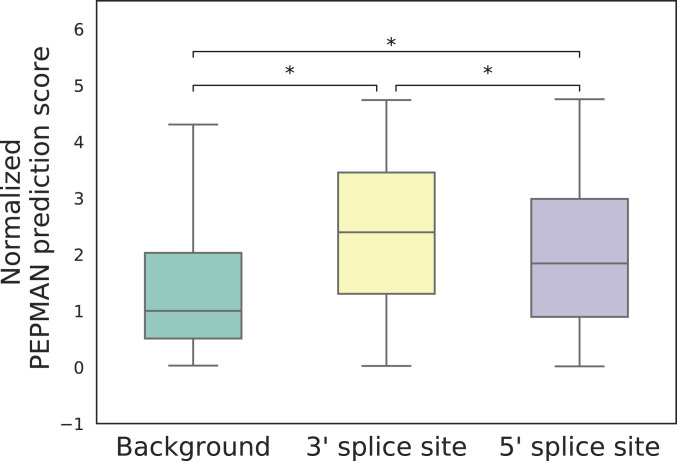
Fig. 4.
Comparative analyses of the PEPMAN prediction scores between splice sites and splice sites. Background: 5,000 randomly sampled positions from the genome. The PEPMAN prediction scores of splice sites are normalized by the median of the prediction results in background. *, two-sided Wilcoxon rank-sum test.

