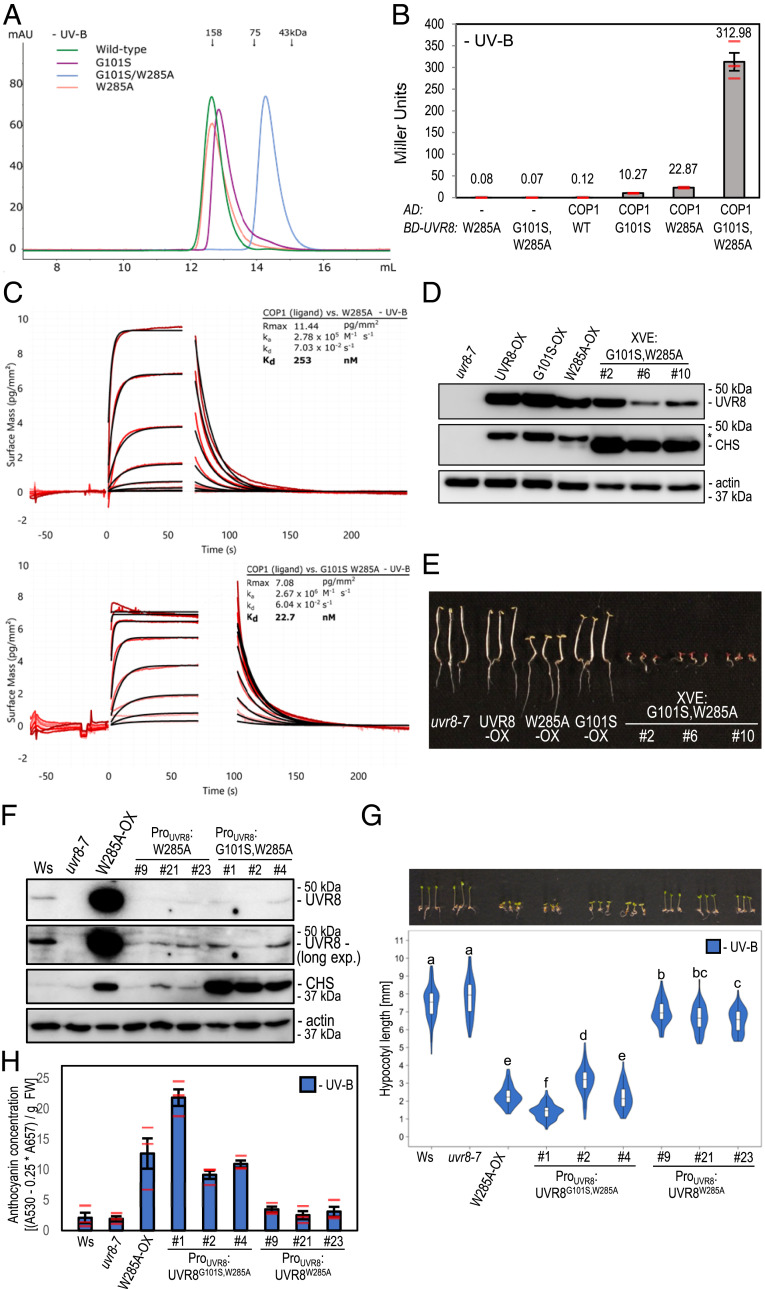
Fig. 3.
Low expression of UVR8G101S,W285A is sufficient for strong constitutive photomorphogenesis. (A) Size-exclusion chromatography of recombinant UVR8 (wild-type), UVR8G101S (G101S), UVR8W285A (W285A), and UVR8G101S,W285A (G101S/W285A) proteins purified from Sf9 insect cells. (B) Quantitative Y2H analysis of the interaction between COP1 and UVR8 (WT), UVR8G101S, UVR8W285A, and UVR8G101S,W285A in the absence of UV-B. AD, activation domain; BD, DNA-binding domain. (C) Binding kinetics of the full-length UVR8W285A and UVR8G101S,W285A versus the COP1 WD40 domain obtained by GCI experiments. Sensorgrams of protein injected are shown in red, with their respective heterogenous ligand binding model fits in black. The following amounts were typically used: ligand – COP1 (2,000 pg/mm2); analyte – UVR8 (2 μM highest concentration). ka, association rate constant; kd, dissociation rate constant; Kd, dissociation constant. (D) Immunoblot analysis of UVR8, CHS, and actin (loading control) protein levels in seedlings of uvr8-7, uvr8-7/Pro35S:UVR8 (UVR8-OX), uvr8-7/Pro35S:UVR8G101S #2 (G101S-OX), uvr8-7/Pro35S:UVR8W285A (W285A-OX), and three independent lines of uvr8-7/XVE:UVR8G101S,W285A (XVE:G101S,W285A #2, #6, and #10) grown on 5 μM estradiol. Asterisk shows residual UVR8 signal after stripping of the polyvinylidene difluoride (PVDF) membrane. (E) Representative image of seedlings described in D grown for 4 d in darkness on plates supplemented with 5 μM estradiol. (Scale bar, 5 mm.) (F) Immunoblot analysis of UVR8, CHS, and actin (loading control) protein levels in wild type (Ws), uvr8-7, uvr8-7/Pro35S:UVR8W285A, and three independent lines of each of uvr8-7/ProUVR8:UVR8W285A (#9, #21, and #23) and uvr8-7/ProUVR8:UVR8G101S,W285A (#1, #2, and #4). (G) Representative seedling images and quantification of hypocotyl length (n > 60) for seedlings described in F. Shared letters indicate no statistically significant difference in the means (P > 0.05). (Scale bar, 5 mm.) (H) Anthocyanin concentration of seedlings described in F. Values of independent measurements (red bars), means, and SEM are shown (n = 3).

