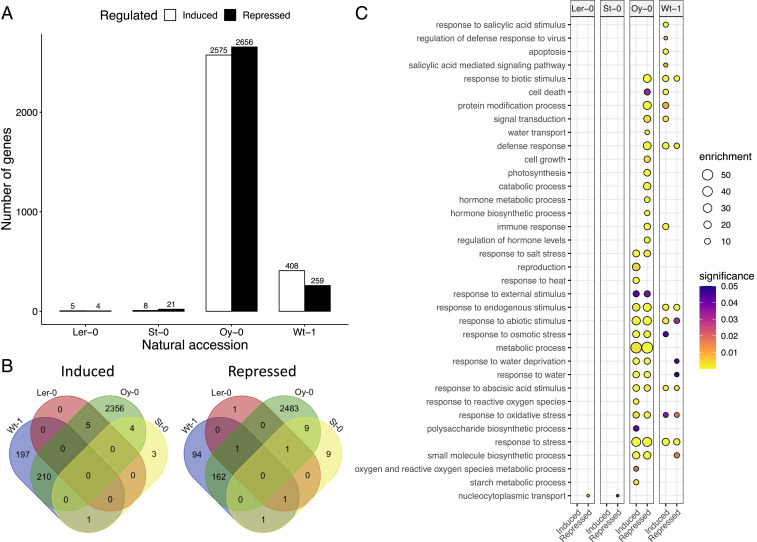
Fig. 2.
Transcriptomic responses of different A. thaliana accessions to TuMV infection. In each accession, the response of a pool of 8 to 10 plants infected with each one of the corresponding drought-evolved TuMV lineages was compared to the response of plants infected with the standard-evolved viral lineages. (A) Number of DEGs obtained for each accession. Overexpressed genes are represented by white bars, and underexpressed genes by black bars. (B) Overexpressed (Left) or underexpressed (Right) DEGs shared between different accessions. (C) Gene ontology analysis for DEGs between drought-evolved viruses and standard-evolved ones for each one of the accessions (columns). Circle size represents the level of enrichment, and color indicates adjusted P values.

