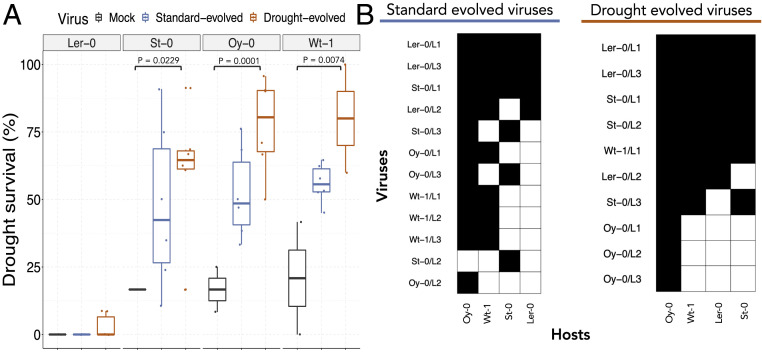
Fig. 5.
Host–virus interactions. (A) Host survival in severe drought stress in different accessions. Comparison between noninoculated plants (gray), plants inoculated with the standard- (blue) and with the drought-evolved (orange) viruses. Significant differences are marked with brackets, and the P values are indicated (pairwise post hoc Bonferroni tests in the GLM described in Eq. 3). (B) Packed infection matrices in standard conditions for standard- and drought-evolved viruses. Viruses used as inocula are ordered (from the most generalist to the most specialist) in the rows and the different hosts (from the most permissive to the least one) in the columns. The black squares represent virus–host combinations in which AUDPS was equal or greater than the value observed for the corresponding viral lineage in its corresponding local host.

