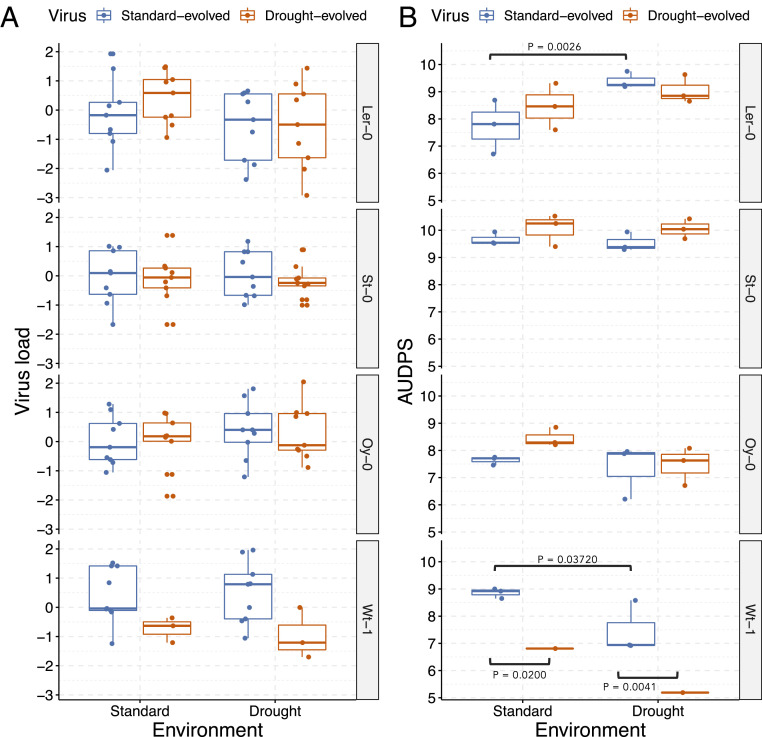
Fig. 6.
Two fitness-related traits quantified in standard and drought conditions; blue color for standard- and orange for drought-evolved viruses. Significant differences are marked with brackets, and the P values are indicated (pairwise post hoc Bonferroni tests in the GLM described in Eq. 2). (A) Z scores of viral loads quantified as copies of CP RNA per nanogram of total RNA (the presence of this protein ensures that the whole virus genome was transcribed and no defective particles were quantified). (B) Disease progression measured as AUDPS.

