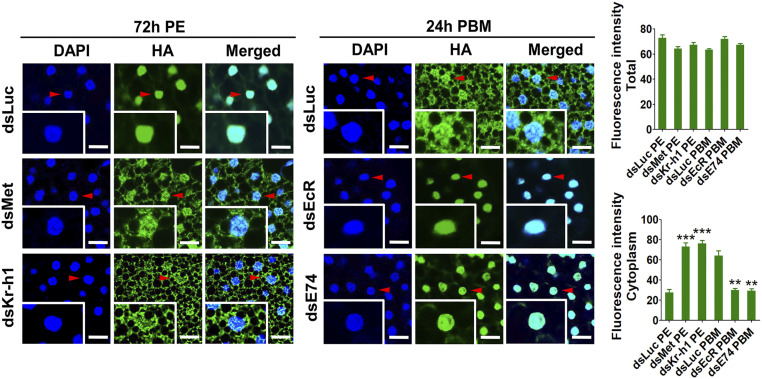
Fig. 5.
FoxO subcellular localization in fat body cells. Confocal microscopic (Leica SP5) images of the fat body cells showing the FoxO-HA (green) and the DAPI signal (blue) (Scale bar: 25 μm.) Insets represent images of single cells. Arrowheads indicate nuclei. The mean fluorescence intensity of green signals indicates total and cytoplasmic FoxO-HA levels. Data represent three independent biological replicates with five images in each replicate and are shown as mean ± SEM **P < 0.01, ***P < 0.001.

