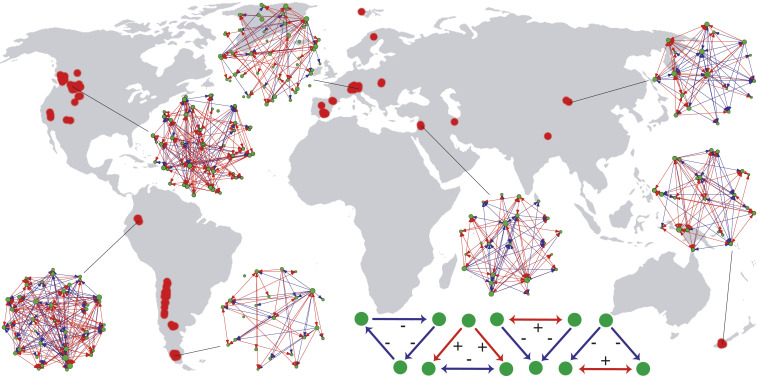
Fig. 1.
Global map of alpine plant networks studied here. Red dots on the map indicate the spatial location of the networks, with a few networks plotted for reference. In the networks, green dots represent plant species, and blue and red arrows represent negative- and positive species associations, respectively. Dot size is proportional to species abundance. The four network modules analyzed here are represented at the bottom of the figure, from left to right: intransitive competition, facilitation-driven competition, and competition-driven facilitation 1 and 2.

