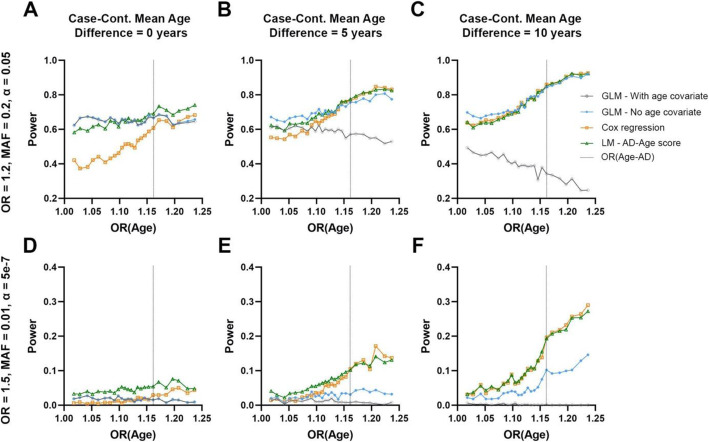
Fig. 2.
Power of different association models for two specific simulation outcomes. a–c A common variant with moderate effect size, evaluated in 1000 cases and 1000 controls at a significance level of α = 0.05, mimicking the condition of common AD cohorts genotyped on SNP arrays. d–f An uncommon variant with large effect size, evaluated in 5000 cases and 5000 controls at a significance level of α = 5 × 10⁻⁷, mimicking the condition of ADSP WES which allows exploration of uncommon and rare variant associations. Panels show power on the y-axis and age-related effect estimates on the x-axis. Outcomes for four models are shown (cf. legend) and the age-related effect estimate for AD [OR (Age-AD)] is marked by a vertical gray dotted line. From left to right, panels show simulation results for increasing mean age differences between cases and controls (cases being younger than controls where applicable)

