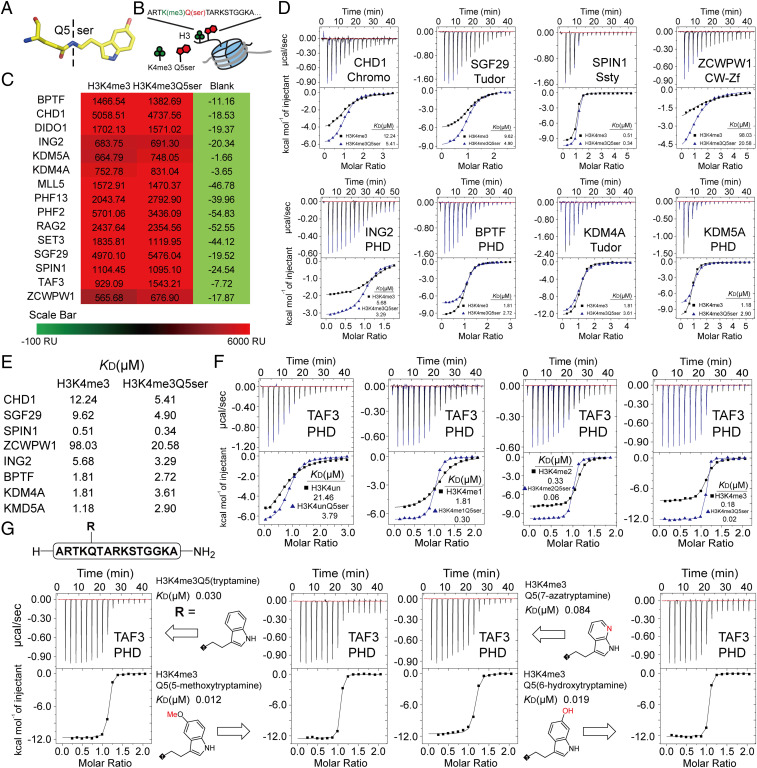
Fig. 1.
Profiling of H3K4me3 readers in response to H3K4me3Q5ser dual modification. (A) Structure of the Q5ser modification. Carbon atoms are shown in yellow; nitrogen atoms are shown in blue; oxygen atoms are shown in red. (B) The coexistence mode of the H3K4me3Q5ser dual modification. (C) SPRi signal of H3(1–15)K4me3 and H3(1–15)K4me3Q5ser peptides toward H3K4me3 readers. The values of SPRi signals are the blanked average signal during 250–300 s of the association curve in SI Appendix, Fig. S1A. (D) Titration curves and fitting curves of H3(1–15)K4me3 and H3(1–15)K4me3Q5ser peptides titrated into H3K4me3 readers. KD values are provided (see SI Appendix, Table. S1 for fitting parameters and error). (E) Summary of binding affinities determined in D. (F) ITC curves of TAF3PHD binding to histone H3 unmodified vs. Q5ser, K4me1 vs. K4me1Q5ser, K4me2 vs. K4me2Q5ser, and K4me3 vs. K4me3Q5ser peptides. KD values are provided (see SI Appendix, Table S1 for fitting parameters and error). (G) ITC curves of TAF3PHD binding to histone H3K4me3Q5(ser-analog) peptides. KD values are provided (see SI Appendix, Table S1 for fitting parameters and error).

