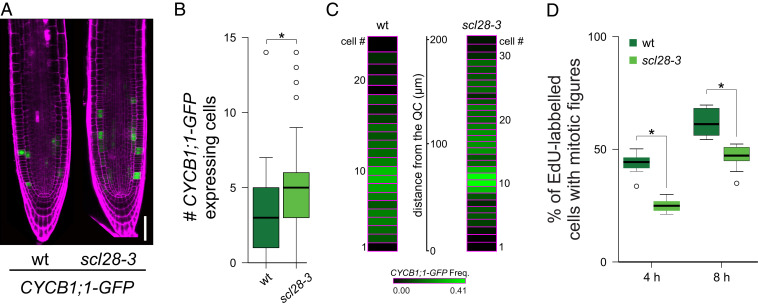
Fig. 4.
SCL28 promotes progression through G2/M. (A) LSCM images of the CYCB1;1-GFP reporter (green) in 6-d-old wild-type (wt) and scl28-3 roots stained with PI (magenta). (Scale bar, 50 μm.) (B) Cell number per meristematic cortex cell file expressing the CYCB1;1-GFP marker. Box plots with the measurements from 15 roots of each genotype are shown. *P < 0.05 (significant differences from the wild type; Student’s t test). (C) Heat map showing the frequency of CYCB1;1-GFP–positive cells at a given position in the root meristem. The frequency of CYCB1;1-GFP–expressing cells was scored from the cell adjacent to the QC shootward in 30 cortex cell files from 15 plants for each genotype. Each box represents a cell position, and the height of the box corresponds to the average length of cortex cells at that particular position. The distance from the QC in microns is indicated. (D) Cell cycle progression through the G2/M phase. Five-day-old plants were pulse-labeled with EdU for 15 min. Seedlings were washed, transferred to MS, and collected at the indicated time points. Root meristematic cells were double-stained with EdU and DAPI, and cells with mitotic figures were counted. Box plots with the percentage of EdU-labeled cells among those with mitotic figures are shown. *P < 0.05 (significant differences from wild type; Student’s t test).

