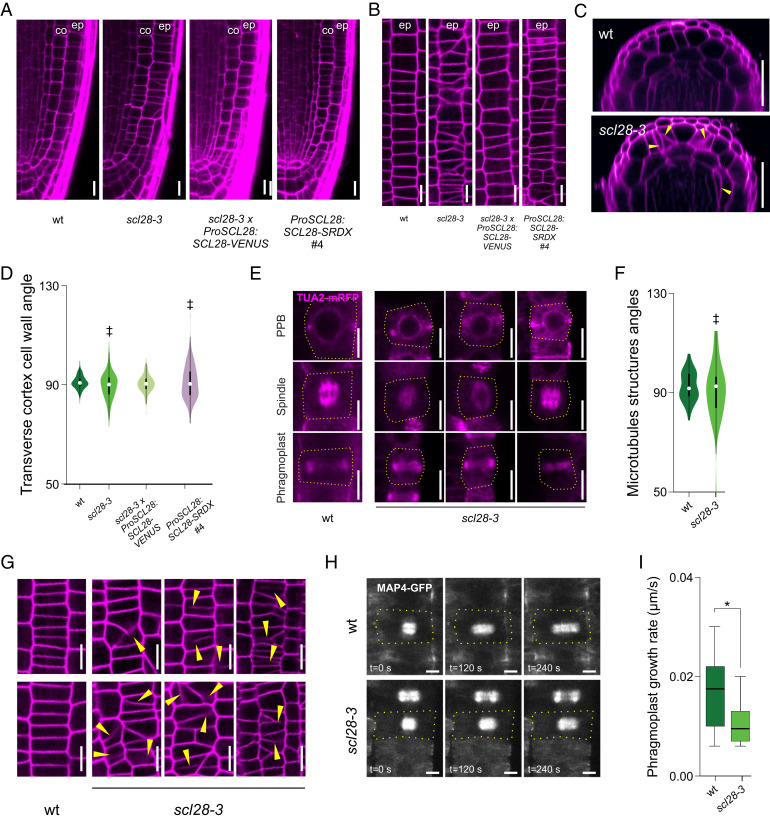
Fig. 5.
SCL28 modulates cell division plane orientation and phragmoplast expansion rate. (A) Cellular organization of the root meristem in wild-type (wt), scl28-3, scl28-3 × ProSCL28:SCL28-VENUS, and ProSCL28:SCL28-SRDX plants examined by LSCM in PI (magenta)-stained plants. “co” and “ep” indicate the cortex and epidermis cell layers, respectively. (Scale bar, 10 μm.) (B) Detailed view of cell wall orientations in meristematic epidermal cells in wild-type, scl28-3, scl28-3 × ProSCL28:SCL28-VENUS, and ProSCL28:SCL28-SRDX #4 plants. To image meristematic epidermal cells, tangential longitudinal optical sections were obtained by LSCM from PI (magenta)-stained plants. “ep” indicate the epidermis cell layer. (Scale bar, 10 μm.) (C) Optical cross-sections of wild-type and scl28-3 roots 100 μm above the QC obtained by LSCM in PI (magenta)-stained plants. Yellow arrowheads mark misplaced, misoriented, curved, and/or incomplete cell walls found only in scl28-3. (Scale bar, 20 μm.) (D) Combined box and violin plot diagrams of the angles between the transverse cortex cell wall and the main longitudinal axis of the root. The data shown are the measurements of 20 cells in 15 different roots of each genotype. ‡P < 0.05 (significant differences in the variance when compared to wild type; F test). (E) Microtubule arrays (PPB, mitotic spindle, and phragmoplast) in meristematic cortex cells of wild-type and scl28-3 plants. Microtubules are detected thanks to an alpha-tubulin 2 RFP reporter (TUA2-RFP). TUA2-mRFP fluorescence is shown in magenta. The dashed yellow line traces cell outlines. (Scale bar, 10 μm.) (F) Combined box and violin plot diagram of the angles between the mitotic microtubule arrays and the main longitudinal axis of the root. The data shown are the measurements of at least 50 cells of each genotype. ‡P < 0.05 (significant differences in the variances; F test). (G) Incomplete and asymmetric cell walls found in meristematic epidermal cells from scl28-3 roots are indicated with yellow arrowheads. These abnormal cell division planes were not found in wild-type plants. To image meristematic epidermal cells, tangential longitudinal optical sections were obtained by LSCM in PI (magenta)-stained plants. (Scale bar, 10 μm.) (H) Phragmoplast expansion in meristematic cortex cells from wild-type and scl28-3 plants. The images show the moment when the disk-phragmoplast has just formed (time, 0 s) and 120 or 240 s later. Microtubules are visualized with the MAP4-GFP reporter (gray scale). The dashed yellow lines mark cell outlines. (Scale bar, 5 μm.) (I) Velocities of phragmoplast expansion (μm/s) in wild-type and scl28-3 meristematic cortex cells. Box plots with the measurements from 27 cells from each genotype are shown. *P < 0.05 (significant differences from the wild type; Student’s t test).

