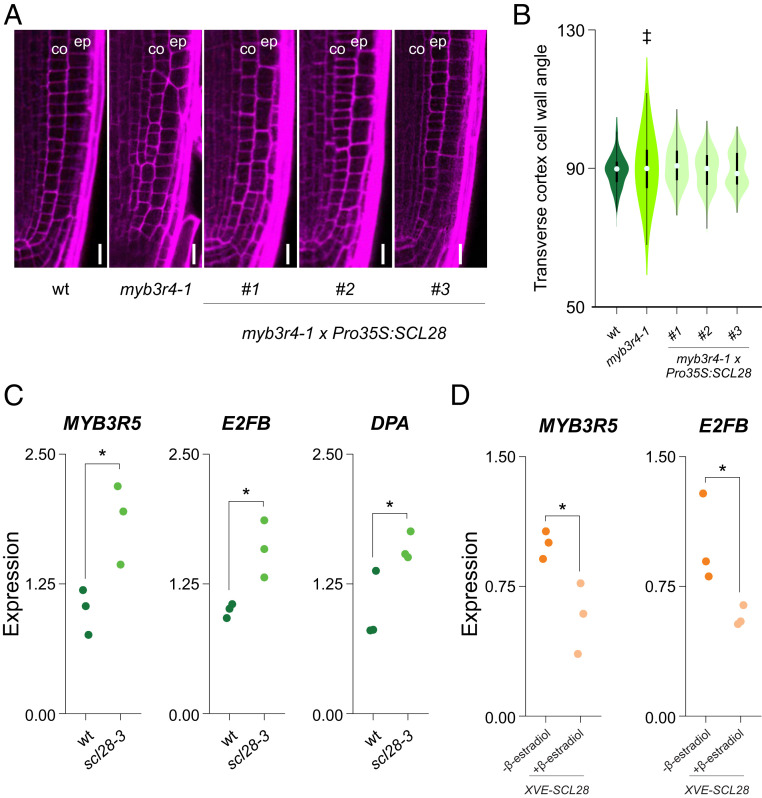
Fig. 6.
Regulatory interactions between MYB3R, E2F, and SCL28. (A) Cellular organization of the root meristem in wild-type (wt), myb3r4-1, and myb3r4-1 × Pro35S:SCL28 plants examined by LSCM in PI (magenta)-stained plants. “co” and “ep” indicate the cortex and epidermis cell layers, respectively. (Scale bar, 10 μm.) (B) Combined box and violin plot diagrams of the angles between the transverse cortex cell wall and the main longitudinal axis of the root in wild-type, myb3r4-1, and independent transgenic lines of myb3r4-1 transformed with Pro35S:SCL28. The data are the measurements of 20 cells in 15 different roots of each genotype. ‡P < 0.05 (significant differences in the variances when compared to wild type; F test). (C) Expression of cell cycle regulators in wild-type and scl28-3 plants. Expression was estimated by RT-qPCR in three biological replicates and normalized to the mean value obtained in wild-type plants. *P < 0.05 (significant differences; Student’s t test). (D) Expression of cell cycle regulators in XVE-SCL28 plants grown in MS media supplemented with 0.25 μM β-estradiol. Expression was estimated by RT-qPCR in three biological replicates and normalized to the mean value obtained in mock-treated control plants. *P < 0.05 (significant differences; Student’s t test).

