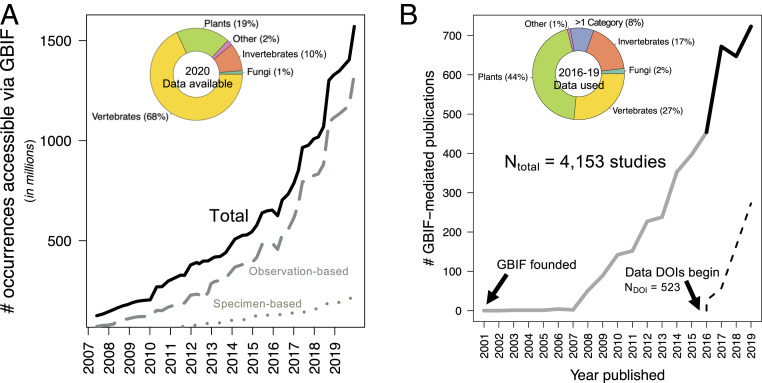
Fig. 1.
Growth over time of the biodiversity occurrence data accessible via the Global Biodiversity Information Facility (GBIF) (A) and peer-reviewed articles using these data (B). Occurrence data (solid line in A) is further broken into observation-based records (dashed) and museum specimen-based records (dotted). Pie charts illustrate proportional taxonomic representation in GBIF datasets as of July 2020 (A) and corresponding representation of data use in recently published articles (2016 to 2019; solid black line) (B). “Other” refers to organismal groups not included in other categories (A and B). “>1 category” refers to data use of multiple organismal groups (B). Citable digital object identifiers (DOIs) were provided with each GBIF data download since 2016 (dash line in B).

