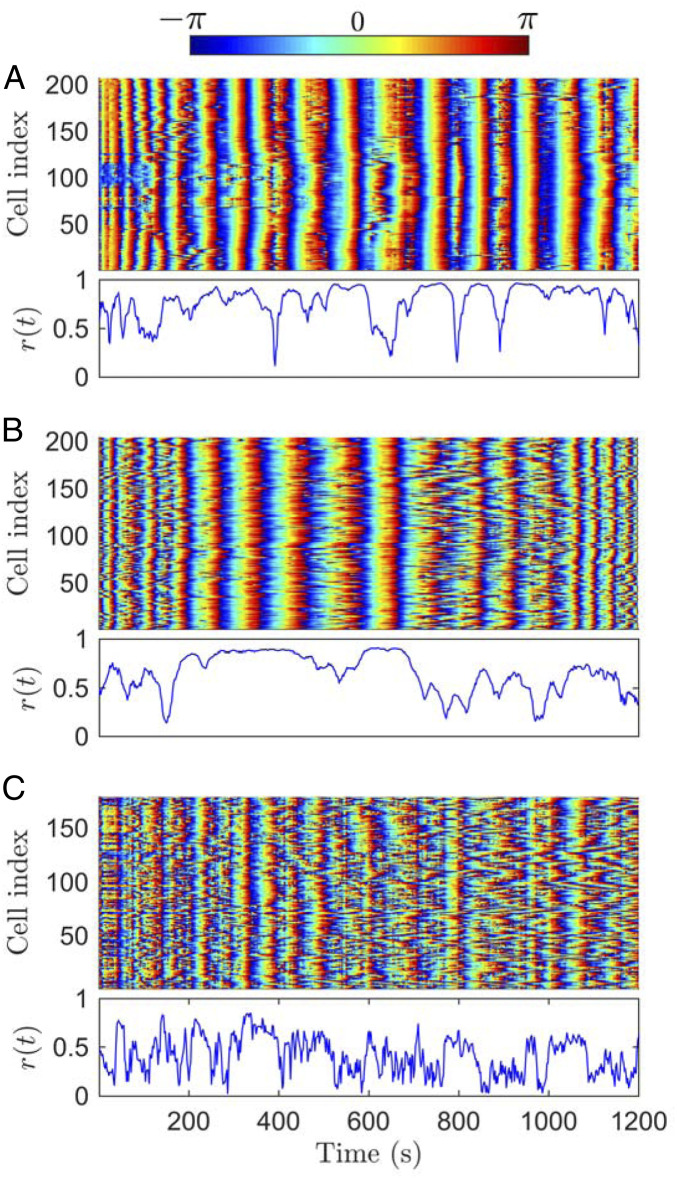
Fig. 2.
Coupling between the glycolytic signals of the single cells. Instantaneous phases (– to ) of the NADH autofluorescent signals for all cells (Top) and normalized order parameter (Bottom) when glycolytic oscillations in yeast cells are triggered using (A) 12, (B) 16, and (C) 20 mM combined with 40 mM GLC. (A and B) At 12 and 16 mM concentrations, the instantaneous cell phases feature global patterns across the cell array corresponding to . The closer the order parameter to 1, the higher the temporal cell synchronization, while a lower order parameter describes cell desynchronization. (C) At high concentrations, this synchronization is lost, reflected in the low values of the order parameter. Each panel shows a representative example from in total five experiments (see SI Appendix, Figs. S3–S7, for the repeat experiments).

