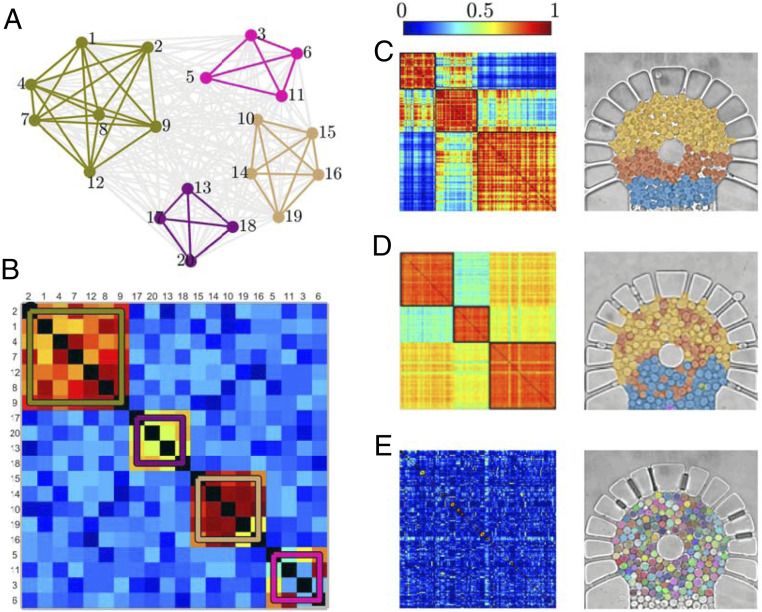
Fig. 3.
Synchronization communities. (A) In a functional graph analysis, the signal correlation between different nodes provides a measure of the strength of connectivity between them. In the resulting graph, it is possible to identify communities of nodes (colored subgraphs) that are well connected with each other but poorly connected to nodes belonging to different communities. (B) Such community structure is reflected in the adjacency matrix representing the graph. Note that the order of the nodes has been rearranged to more clearly highlight the community structure. (C–E) Similarly, from the NADH autofluorescent signals of the cells (each tagged with a number used for identification purposes), we construct adjacency matrices and overlay the resulting communities on the images of the corresponding cell arrays for (C) 12, (D) 16, and (E) 20 mM . The figure shows a representative example from five experiments (see SI Appendix, Figs. S3–S7, for the repeat experiments).

