Fig. 1.
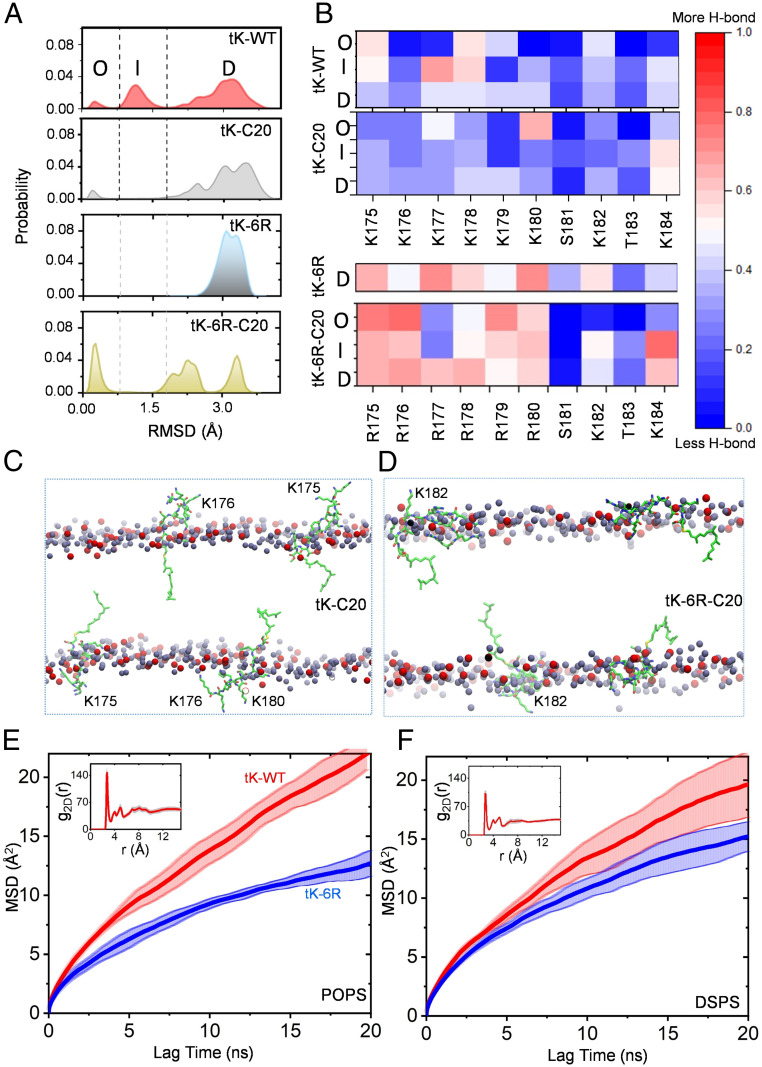
The equally charged KRAS PBD anchors sample distinct conformational states on PtdSer bilayers. (A) Probability distribution of the rmsd of the Cα atoms of residues 177 to 182 was calculated for four equally charged KRAS PBD anchors: tK-WT (the original PBD), tK-C20, tK-6R, and tK-6R-C20 (sequences shown in SI Appendix, Fig. S1). The dotted lines demarcate the three distinct conformational groups of the peptides, O (<0.8 Å), D (>1.8 Å), and I, that lie in between these two (except for tK-6R-C20, where it spans the 1.5- to 2.5-Å range). (B) Heat maps of the frequency of hydrogen bonds between individual side chains with PtdSer separately for the KRAS PBD anchors in the O, I, and D conformational states. (C and D) The last snapshot from the simulation of tK-C20 (C) and tK-6K-C20 (D) in POPC/POPS (chemical structure illustrated in SI Appendix, Fig. S2) showing the dynamic structural organization of the four peptides per simulation (carbon in green, nitrogen in blue, and oxygen in red) in the bilayer. Only the phosphorus atoms of POPS (red) and POPC (dark gray) are shown; all other atoms including lipid acyl chains, water, and ions are omitted for clarity. Selected, transiently solvent-exposed residues of the tK peptides are labeled for reference. (E and F) MSD as a function of lag time for the Cα atom of the farnesylated cysteine of tK-WT (red) and tK-6R (blue) in a bilayer of 80% POPC and 20% POPS (E) or 20% DSPS (F); insets show the 2D radial pair distribution function, g2D(r), for the headgroup oxygen atoms of POPS (E) and DSPS (F) lipids around the side-chain nitrogen atoms of lysine and oxygen atoms of serine/threonine residues in tK-WT. These analyses were performed by dividing the last 300 ns of the simulation data into three blocks of 100 ns each so that the solid lines represent the mean and the shaded background the SD over the three blocks. Diffusion characteristics of POPS and DSPS lipids are shown in SI Appendix, Fig. S3.

