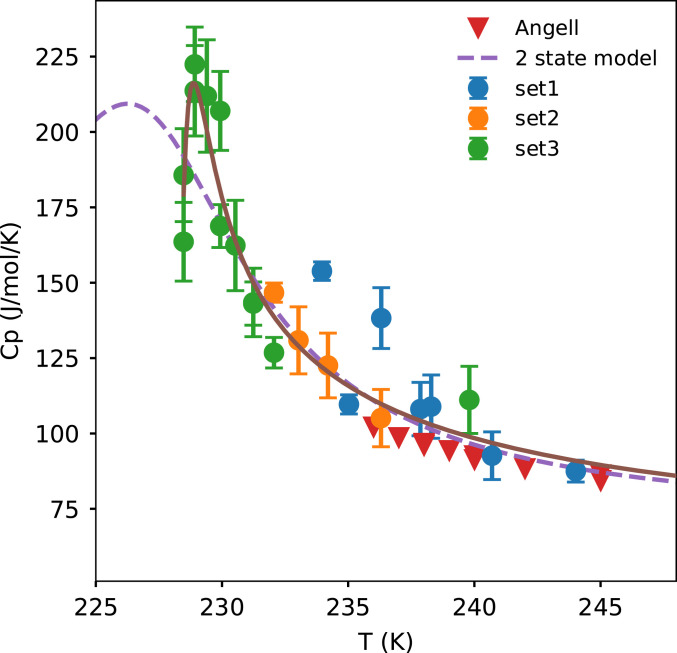
Fig. 5.
The specific-heat capacity of water measured from three different datasets. The brown line is a guide to the eye. The Angell data are taken from ref. 17. and the two-state model data are taken from ref. 28. The error bars are SEMs calculated according to SI Appendix, section 7.

