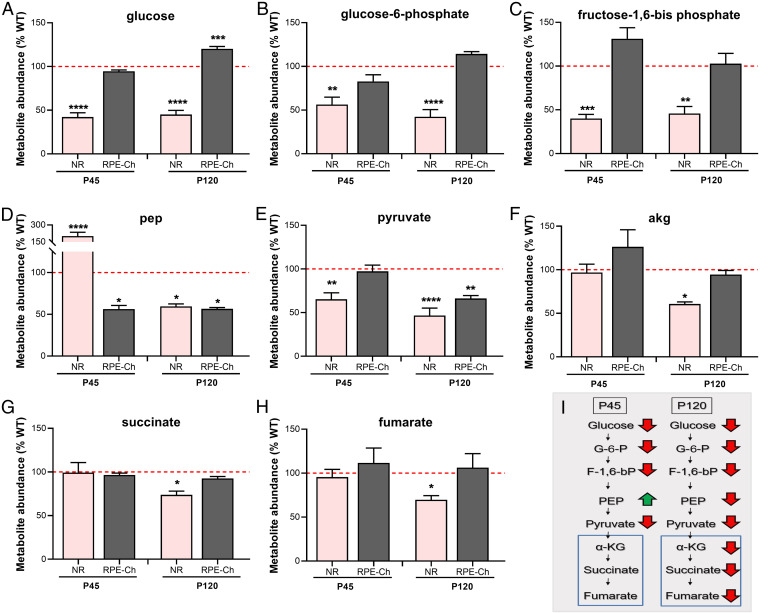
Fig. 2.
Absence of RTBDN leads to reduced glycolysis at P45 followed by reduced TCA cycle at P120. Steady state levels of key glycolytic (A–E) and TCA cycle (F–H) metabolites were quantified in NR and RPE-Ch Rtbdn−/− and WT controls at P45 and P120. Tissues were collected as indicated in the Materials and Methods section, with n = 10 for A–H. The unit of y axis as metabolite abundance reflects the normalized metabolite concentration for the individual metabolite. Values are presented for Rtbdn−/− as percent of age-matched WT (red dotted line is set at 100). Statistical comparisons shown were made between the WT and Rtbdn−/− for the individual metabolite of each tissue at the respective ages. (I) A flowchart summarizing the changes in the NR, with the TCA cycle metabolites being marked with a blue box. Metabolites elevated in Rtbdn−/− are shown next to green arrows and those reduced are next to red arrows, while the ones lacking significant difference are unmarked. Student’s t test was used to test significance, with *P < 0.05, **P < 0.01, ***P < 0.001, and ****P < 0.0001. (NR, neural retina; RPE-Ch, RPE–Choroid).

