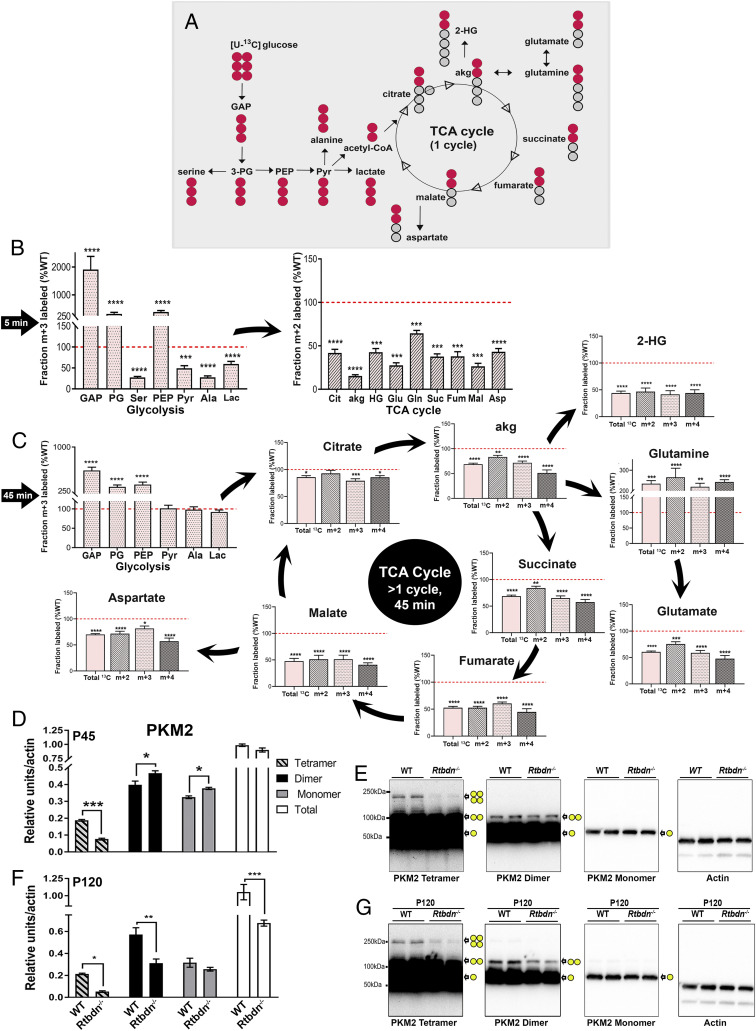
Fig. 3.
RTBDN is required for sustaining glucose flux in the neural retina. (A) Flowchart depicting the flow of 13C isotopologues (red circles) from [U-13C] glucose through glycolysis and TCA cycle intermediates for a single span of the cycle. Circles represent the carbons in each intermediate. (B) Isotopologues were quantified for each glycolytic (m + 3) and TCA cycle (m + 2) metabolites after 5 min incubation with 13C-glucose. (C) Isotopologues were quantified for each glycolytic (m + 3) and TCA cycle (m + 2, m + 3, m + 4, and total 13C) metabolites after 45 min incubation with 13C-glucose. Values are presented for Rtbdn−/− neural retina (P45) as percent of age-matched WT (red dotted line is set at 100). Statistical comparisons were made between the WT and Rtbdn−/− for the individual metabolite of each tissue at P45. Tissues were collected as indicated in the Materials and Methods section, with n = 10 for B and C. (D) Oligomers of PKM2 were quantified by densitometric analysis of various exposures of three independent immunoblots, each having two different samples from different mice at P45, for both WT and Rtbdn−/−. (E) A representative immunoblot from P45 mice showing three different oligomers of PKM2 at increasing exposure times on the same immunoblot. (F) Densitometric analysis of PKM2 oligomers at P120 from different mice for both WT and Rtbdn−/− (n = 6) and (G) representative immunoblots showing three different oligomers of PKM2 from P120 mice. Subsequently, it was probed for actin, as shown. Yellow circles represent PKM2 forms of monomer, dimer, and tetramer at their individual localization on the immunoblot. All fold changes shown are significant (with P < 0.0001 using Student’s t test) *P < 0.05, **P < 0.01, ***P < 0.001, and ****P < 0.0001.

