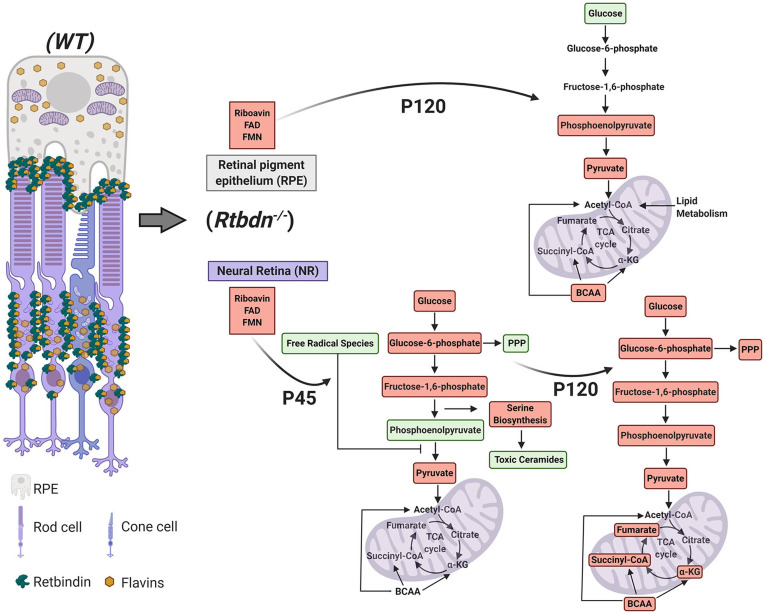
Fig. 5.
Graphical representation of the effect of RTBDN ablation on NR-RPE metabolic homeostasis. Localization of RTBDN-bound flavin is shown in the WT neural retina–RPE junction and in the photoreceptor inner segment. In its absence, the resulting metabolic abnormalities in neural retina at P45 and P120 and in RPE at P120 are shown. Peach boxes represent significant reduction, while green boxes represent significant elevation.

