Fig. 3.
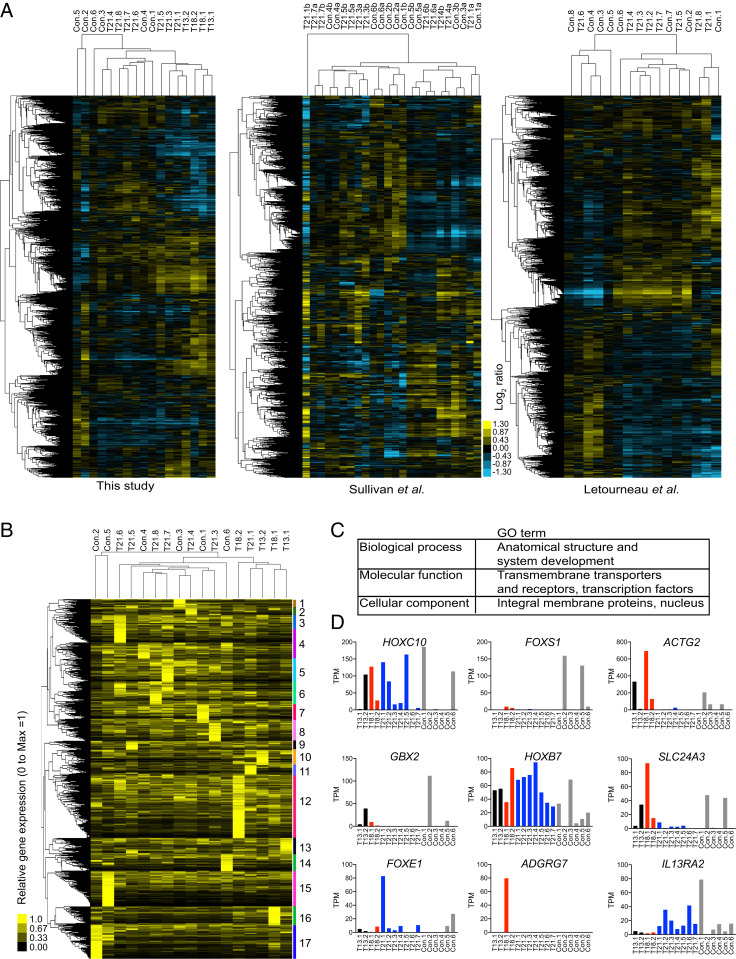
Interindividual variability drives gene expression patterns of human primary fibroblasts. (A) The hierarchical clustering analysis of the expression patterns of primary fibroblasts analyzed in this study and in the studies by Sullivan et al. (20) and Letourneau et al. (16) are shown. The expression patterns cluster independent of the karyotype of the cell line. (B) The relative gene expression of genes uniquely expressed in some cell lines. The hierarchical clustering analysis revealed 17 clusters specific for each cell line. (C) The gene ontology enrichment analysis shows that the uniquely expressed genes are enriched in master transcription factors that regulate development and cell surface markers, including transmembrane transporters and receptors proteins. (D) Examples of the normalized TPM of a couple of genes highly expressed in some cell lines but poorly expressed in others. Black, red, blue, and gray bars correspond to expression in trisomy 13, 18, 21, and controls, respectively.

