Fig. 5.
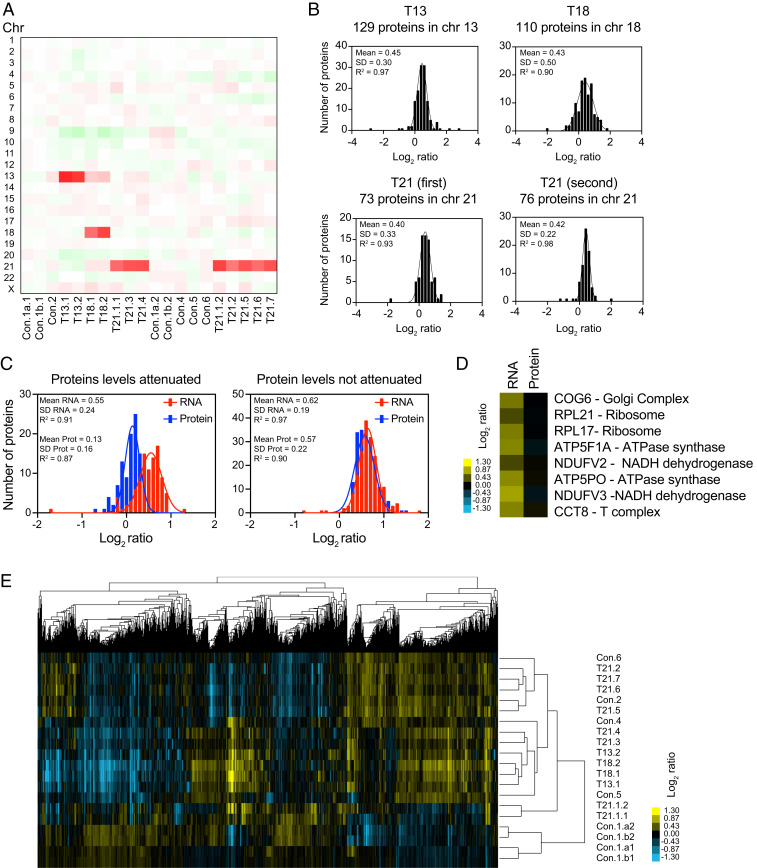
Protein levels of subunits of macromolecular complexes are attenuated in trisomic primary fibroblasts. (A) A heatmap of the average protein levels per chromosome in primary fibroblasts. The experiments (columns) for each cell line are ordered by chromosome position. (B) A histogram of the average log2 ratios of the protein levels of genes located on chromosome 13 in trisomy 13 cell lines on chromosome 18 in trisomy 18 cell lines, on chromosome 21 in trisomy 21 cell lines in the first and second datasets, relative to euploid controls are shown. The bin size for all histograms is log2 ratio of 0.2. Fits to a normal distribution (black line), means, SD, and goodness of fit (R2) are shown for each distribution. (C) A histogram of the average log2 ratios of the RNA (red) and protein (blue) levels of triplicated genes that show protein levels lower than predicted (Left) and 1.5-fold changes in trisomic fibroblasts. The bin size for all histograms is log2 ratio of 0.1. Fits to a normal distribution (solid lines), means, SD, and goodness of fit (R2) are shown for each distribution. (D) A few examples of individual subunits located on triplicated chromosomes that show attenuation at the protein levels compared to RNA. COG6 and RPL21 are in chromosome 13. RPL17, ATP5F1A, and NDUFV2 are in chromosome18. ATP5PO, NDUFV3, and CCT8 are in chromosome 21. (E) The hierarchical clustering analyses of proteome profiles do not cluster by karyotype of the cell lines.

