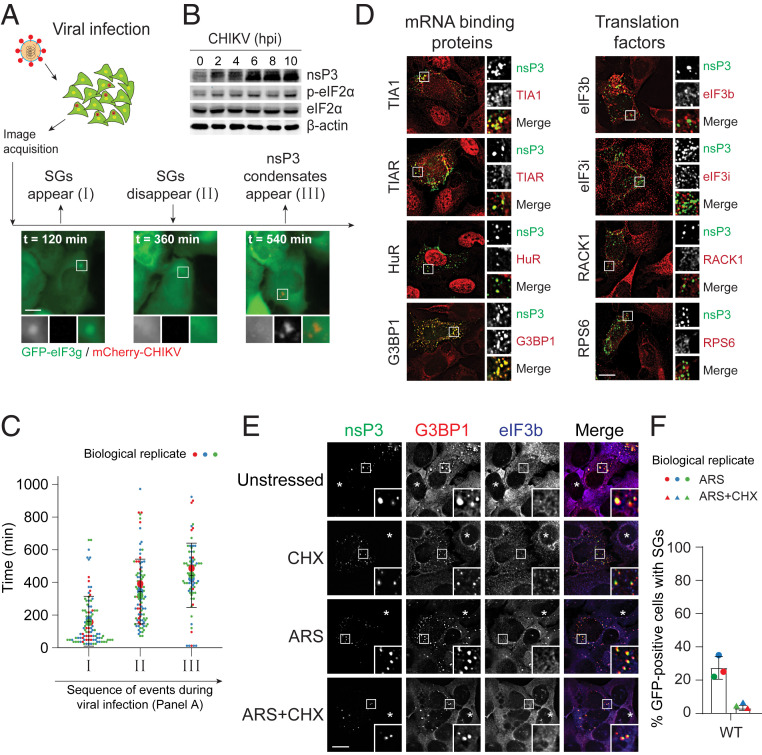
Fig. 1.
Two distinct classes of biomolecular condensates form during alphavirus infection. (A) U2OS cells stably expressing GFP-eIF3g were infected with WT CHIKVmCherry at MOI of 10, subjected to live cell imaging with the time-lapse interval of 12 min over 14 h. Images shown are the snapshots of different infection stages. (B) U2OS cells were either mock-infected or infected with CHIKV. Twelve hours postinfection, cells were lysed and blotted against indicated antibodies. (C) Violin plot shows the distribution of time points (minutes) representing SG appearance, disappearance, and nsP3 condensate appearance. Ninety-seven cells from three independent experiments were included, and the time points at which SGs appeared/disappeared and nsP3 condensates appeared were measured within each cell. Error bars correspond to SD. (D) U2OS cells were infected with CHIKV WT at MOI of 1. At 6 h postinfection (hpi), cells were fixed and immunostained for nsP3 and indicated SG proteins. (E) U2OS cells transfected with GFP-tagged nsP3WT were either unstressed, treated with 100 μg/mL cycloheximide (CHX), 0.2 mM arsenite alone (ARS), or cotreated with 0.2 mM arsenite and 100 μg/mL cycloheximide (ARS+CHX) for 30 min. Cells were then fixed and immunostained for G3BP1 (red) and eIF3b (blue). Asterisks indicate untransfected cells. (F) Bar graph shows the percentage of GFP-positive cells with SGs from three independent experiments. Error bars correspond to mean ± SD. (Scale bars, 10 μm.)

