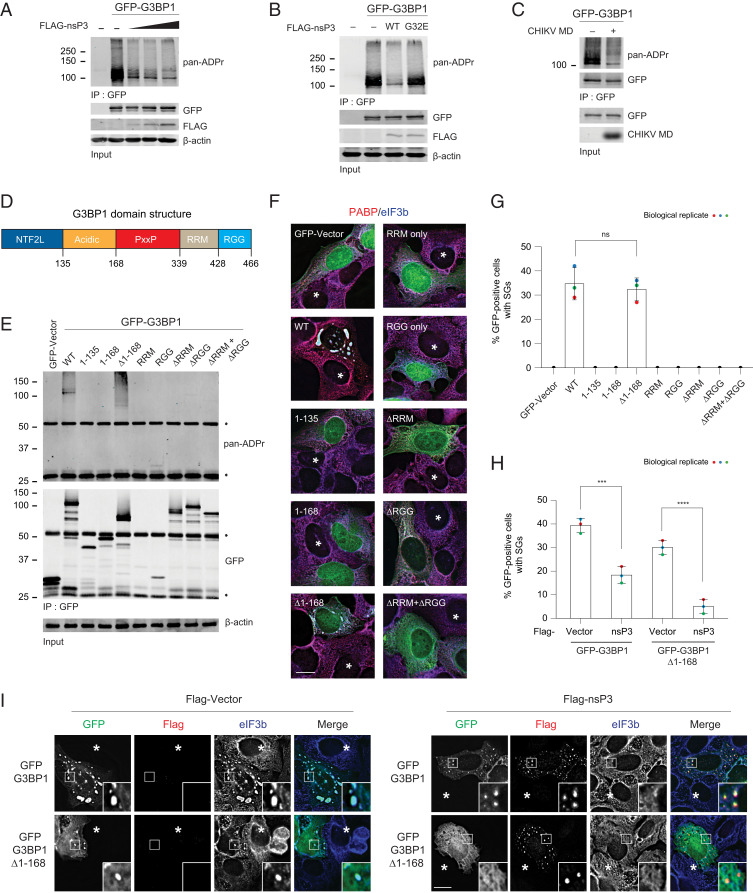
Fig. 5.
nsP3 reduces ADP-ribosylation of the essential SG component G3BP1. (A) 293F cells were transfected with either GFP, GFP-tagged G3BP1 alone, or cotransfected with GFP-tagged G3BP1 with increasing concentration of FLAG-tagged nsP3WT. After 24-h transfection, cells were pelleted, lysed, immunoprecipitated using anti-GFP antibodies, and immunoblotted with pan-ADPr reagent. (B) 293F cells were transfected with GFP, GFP-tagged G3BP1 alone, or cotransfected GFP-tagged G3BP1 with either FLAG-tagged nsP3WT or nsP3G32E. Twenty-four hours posttransfection, cells were pelleted, lysed, immunoprecipitated using anti-GFP antibodies, and immunoblotted with pan-ADPr reagent. (C) 293F cells transfected with GFP-tagged G3BP1 were lysed and immunoprecipitated using anti-GFP antibodies. The immunoprecipitates were split into two halves and incubated either with buffer or 5 μg CHIKV MD for 1 h at 37 °C. After incubation, the beads were washed and blotted with pan-ADPr reagent. (D) Schematic representation of G3BP1 domain structure. (E–G) U2OS G3BP1/2 double knockout (dKO) cells were transfected with either GFP vector or GFP-tagged G3BP1 constructs for 36 h. (E) Cells were then either lysed, immunoprecipitated using anti-GFP antibodies, and blotted with pan-ADPr reagent (asterisks indicate heavy and light chain) or (F) permeabilized, fixed, and immunostained for PABP (red) and eIF3b (blue). Asterisks indicate untransfected cells. (G) Bar graph shows the percentage of GFP-positive cells with SGs. ns, nonsignificant, two-tailed, unpaired Student’s t test. Error bars correspond to mean ± SD with n = 3. (H and I) U2OS G3BP1/2 dKO cells were cotransfected in two combinations: 1) FLAG-vector with GFP-tagged G3BP1 or G3BP1 ∆1–168, and 2) FLAG-tagged nsP3 with GFP-tagged G3BP1 or G3BP1 ∆1–168. At 36 h posttransfection, cells were fixed and stained for FLAG (red) and eIF3b (blue). Asterisks indicate untransfected cells. Bar graph shows the percentage of GFP-positive cells with SGs. ***P < 0.001, ****P < 0.0001, two-tailed, unpaired Student’s t test. Error bars correspond to mean ± SD with n = 3. (Scale bars, 10 μm.)

