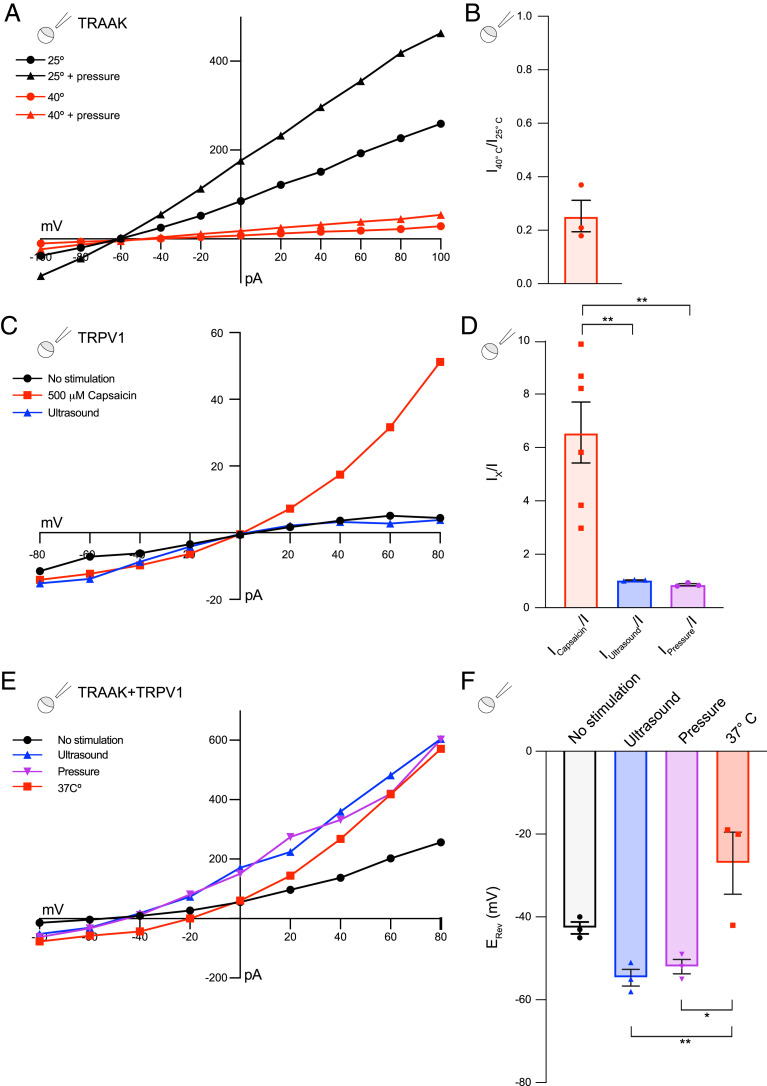
Fig. 2.
Mechanosensitive TRAAK channels, but not thermosensitive TRPV1 channels, are activated by ultrasound. (A) A representative current–voltage relationship recorded from an inside-out patch of a TRAAK-expressing oocyte without (circles) and with applied pressure (triangles) at 25 °C (black) and 40 °C (red). (B) The reduction of the TRAAK current at 40 °C relative to 25 °C recorded at 0 mV (relative activity 0.25 ± 0.06 [mean ± SEM, n = 3 patches]). (C) A representative current–voltage relationship recorded from an inside-out patch of a TRPV1-expressing oocyte without stimulation (black circles), during ultrasound stimulation (10 ms, 0.6 W/cm2 at 5 MHz, blue triangles), and following application of 500 µM capsaicin (red squares). (D) The fold activation of TRPV1 currents at +100 mV during the application of 500 µM capsaicin (red), during ultrasound stimulation (10 ms, 0.6 W/cm2 at 5 MHz blue), or during negative pressure stimulation (10 ms, −35 mmHg purple) (6.5 ± 1.1, 1.0 ± 0.01 and 0.9 ± 0.03-fold, mean ± SEM, n = 6, 3, and 3 patches, respectively), **P < 0.01, one-way ANOVA with Tukey correction). (E) A representative current–voltage relationship recorded from an inside-out patch of a TRAAK- and TRPV1-coexpressing oocyte without stimulation (black circles), during ultrasound stimulation (10 ms, 0.5 W/cm2 at 5 MHz, blue triangles), during pressure application (10 ms, −35 mmHg, purple inverted triangles), or during 37 °C bath solution application (red squares). (F) The reversal potential of currents recorded from TRAAK- and TRPV1-coexpressing oocyte patches under different conditions colored as in E (−43 ± 1 mV, −55 ± 2 mV, −52 ± 2 mV, and −27 ± 8 mV for basal, ultrasound-stimulated, pressure-stimulated, and heat-stimulated currents, respectively, mean ± SEM, n = 3 patches, **P = 0.06, *P = 0.01, one-way ANOVA test with Tukey correction).

