Fig. 5.
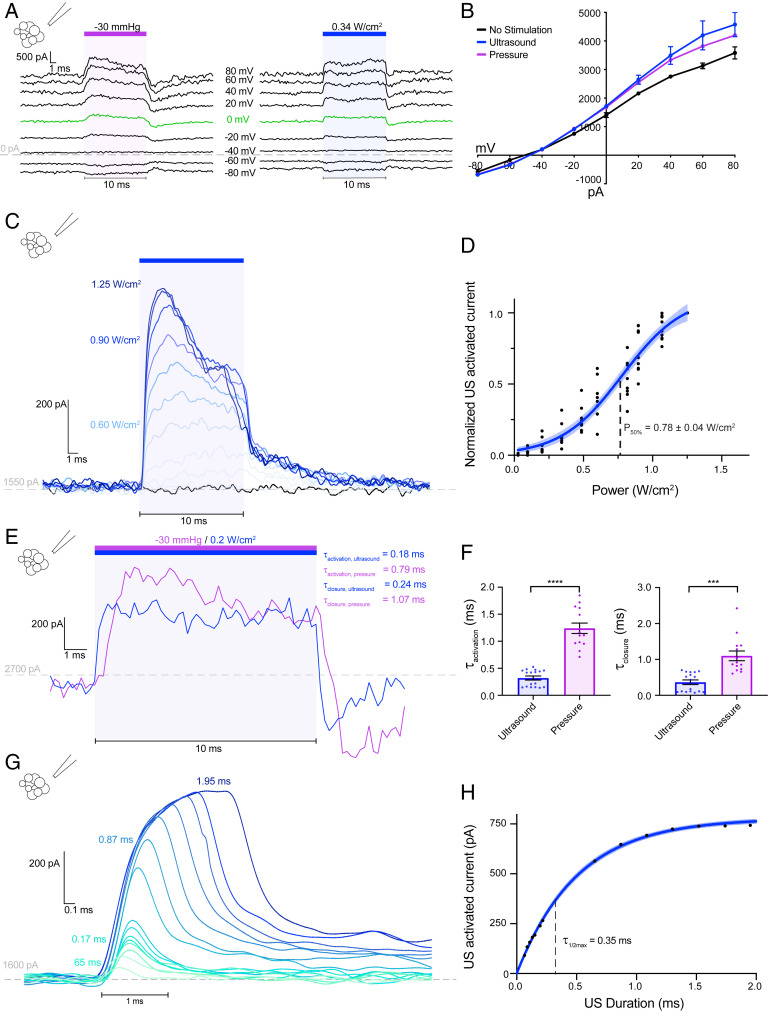
Ultrasound activates purified TRAAK channels reconstituted into lipid membranes. Current recordings from patches of purified TRAAK reconstituted into proteoliposomes. (A) Currents recorded during a voltage step protocol (Vhold = −50 mV, Vtest = −80 to +80 mV, ΔV = 10 mV, 20mV increments shown). A pressure (−30 mmHg, purple bar, Left) or ultrasound step (0.34 W/cm2 at 5 MHz, blue bar, Right) was applied during each voltage step. (B) The current–voltage relationship of data in A. The average current before stimulation (black) and peak currents during pressure (purple) and ultrasound (blue) stimulation are shown (mean ± SEM, n = 3 sweeps). (C) An overlay of currents during steps of increasing ultrasound power colored from light to dark blue (Vtest = 0 mV). (D) The normalized ultrasound-induced TRAAK current versus ultrasound power (Vtest = 0 mV). A Boltzmann fit with 95% CI is shown (n = 7 patches). (E) An overlay of TRAAK current response from the same patch to ultrasound (blue) and pressure (purple) (Vtest = 0 mV). (F) The time constant of channel activation and closure in response to ultrasound and pressure (𝜏activation, ultrasound = 0.32 ± 0.04 ms, 𝜏activation, pressure = 1.24 ± 0.10 ms, 𝜏close, ultrasound = 0.37 ± 0.06 ms, 𝜏close, pressure = 1.10 ± 0.14 ms, n = 17 and 14 records for ultrasound and pressure, respectively, from 2 proteoliposomes ****P < 0.0001, Welch’s t test). (G) An overlay of TRAAK current response to ultrasound stimulation of increasing duration colored from green to blue (Vtest = 0 mV). (H) The maximum current response versus stimulus duration. A fit with 95% CI is shown.

