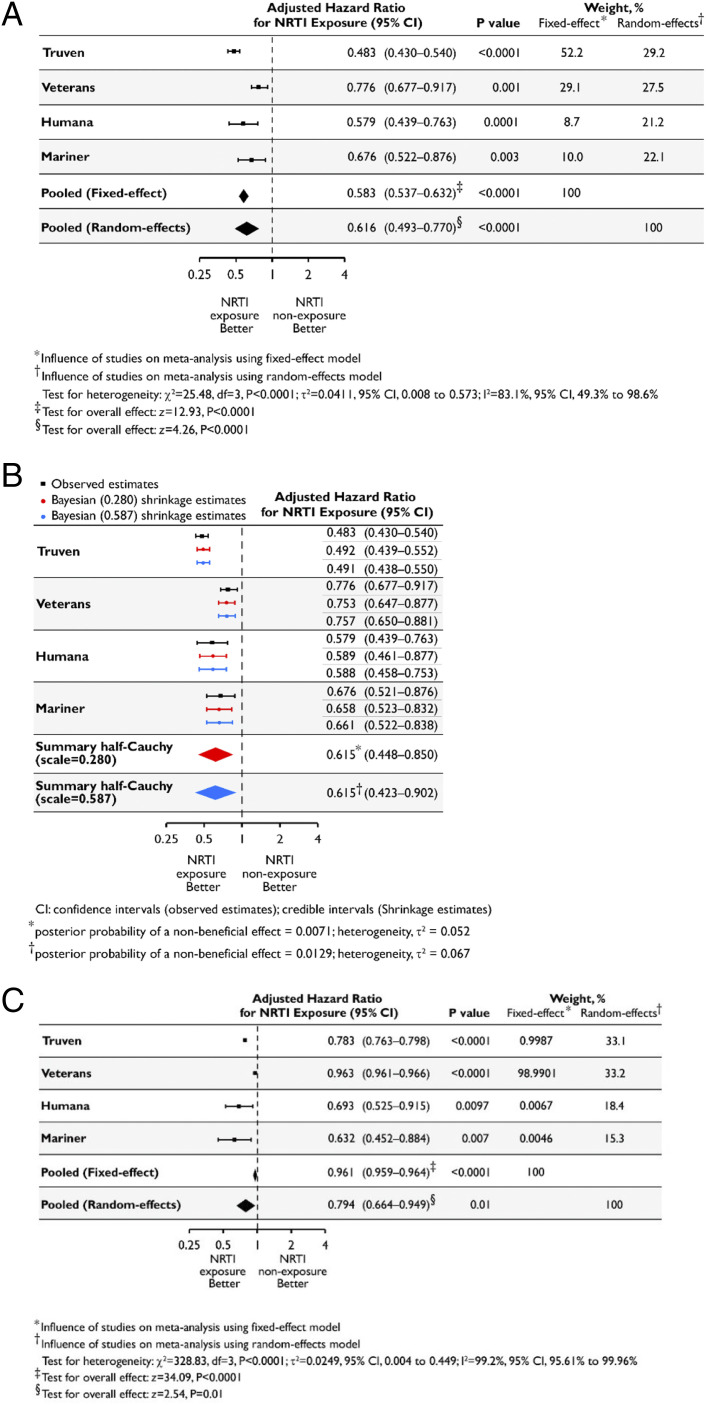
Fig. 5.
NRTI use is associated with reduced hazard of incident atrophic AMD. (A–C) Using methodology employed in ref. 58, aHRs estimated separately for each database shown in black along with their 95% CIs, along with fixed-effect and random-effects meta-analyses shown in diamonds. The dashed vertical line denotes a HR of 1.0, which represents no difference in risk between nucleoside reverse-transcriptase inhibitor (NRTI) exposure and nonexposure. The horizontal bars represent 95% CIs. P values derived from z statistics for individual databases are reported. The estimates of heterogeneity (τ2), results of the statistical test of heterogeneity using the χ2 test statistic and its degrees of freedom (df), and posterior probabilities of a nonbeneficial effect for each model are shown below the plot. The Higgins I2 statistic and its 95% CI are presented. The results of the statistical tests of overall effect, the z-test statistics, and corresponding P values are presented. (A) HRs based on a Cox proportional-hazards model and adjusted for the confounding variables listed in SI Appendix were estimated separately for each database. Inverse-variance–weighted random-effects and fixed-effect meta-analyses were performed to obtain a pooled estimate of the aHR of incident atrophic AMD for NRTI exposure (ever vs. never). (B) HRs based on a Cox proportional-hazards model and adjusted for the confounding variables listed in SI Appendix, Supplementary Methods, were estimated separately for each database and are shown in black along with their 95% CIs. A Bayesian meta-analysis was performed using a random-effects model and a weakly informative hierarchical half-Cauchy prior distribution for between-study variance with the assumption that it was unlikely for the between-study HRs to vary by more than threefold (scale = 0.280). A sensitivity analysis to the choice of the prior by assuming that it was unlikely for the between-study HRs to vary by more than 10-fold was also performed (scale = 0.587). The Bayesian shrinkage estimates and the summary estimates of the aHR of incident atrophic AMD for NRTI exposure (ever vs. never), along with the 95% credible intervals, are shown in red (scale = 0.280) and blue (scale = 0.587). (C) HR estimates derived from propensity score-matched models adjusted for the confounding variables listed in SI Appendix, Supplementary Methods, were estimated separately for each database. Inverse-variance–weighted random-effects and fixed-effect meta-analyses were performed to obtain a pooled estimate of the aHR of incident atrophic AMD for NRTI exposure (ever vs. never).

