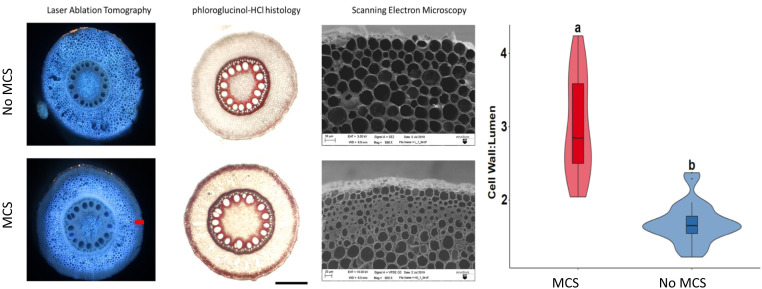
Fig. 1.
LAT can be used to quickly and accurately phenotype MCS. Lines with MCS have smaller and thicker outer cortical cells. These thickened cortical cells are stained red with phloroglucinol-HCl due to their high lignin content. Cryo-SEM images show detailed images of the smaller cells with thick cell walls in the outer cortex. (Scale bar, 100 µm.) Violin plot showing median, interquartile range, 95% CIs, and frequency of cell wall:lumen area ratio for MCS (n = 27) and non-MCS (n = 26) root samples. Letters denote significant differences as determined by Welch’s two-sample t-test at a confidence level of α ≤ 0.05.

