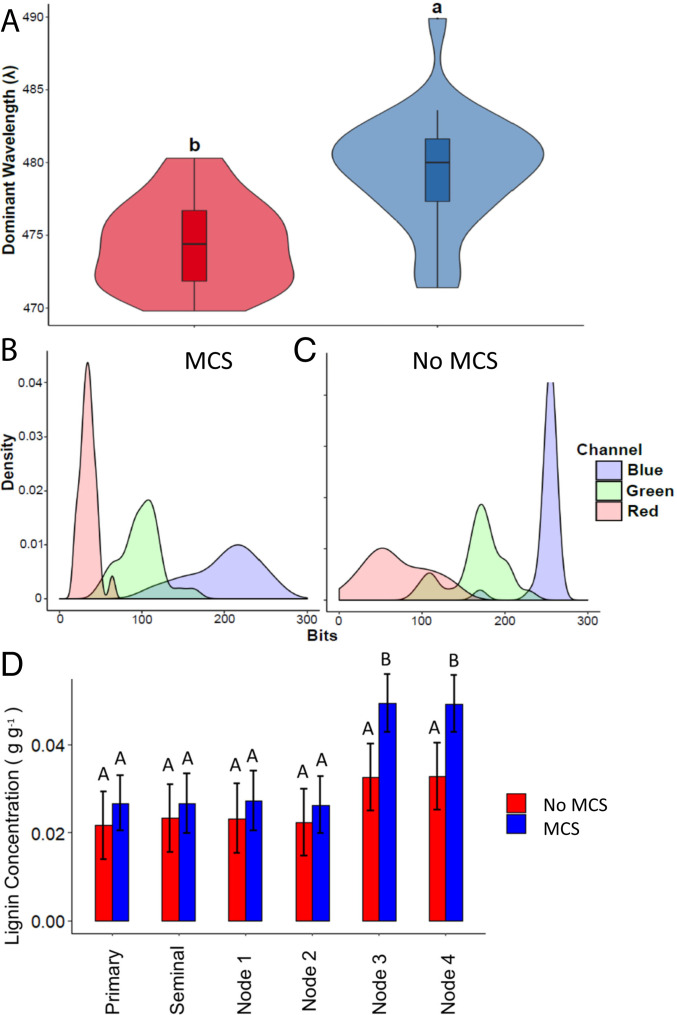
Fig. 3.
(A) Violin plot showing median, interquartile range, 95% CIs, and frequency of dominant emission wavelength (λ) for the outer cortical region of high (n = 27) and low lignin roots (n = 26). Letters denote significant difference as determined by Welch’s two-sample t-test at a confidence level of α ≤ 0.05. (B and C) Density plots of modal R, G, and B values for pixels in outer cortical region of roots with MCS (B) and non-MCS (C). (D) Root lignin concentrations and MCS in different root classes and nodes. Root lignin concentrations are not significantly different in primary, seminal, and first- and second-node crown roots in genotypes with and without MCS. Root lignin concentrations were measured in all tissues of the entire root. Roots with MCS had significantly greater lignin concentrations compared to roots with no MCS in third and fourth-node crown roots. Data shown are means ± SE for three genotypes per group (n = 12). Means with the same letters are not significantly different (P ≤ 0.05).

