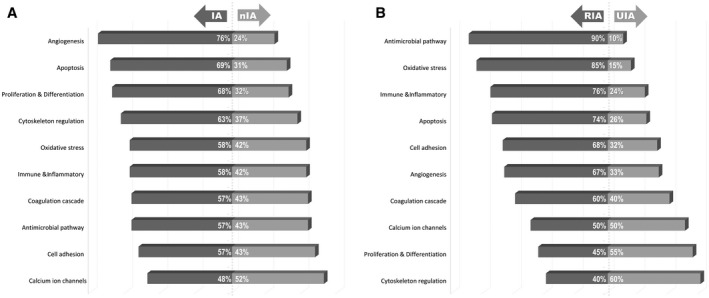
Figure 2.

Distribution of the most common 10 functional pathways between the primary review endpoints (in percentages). A. For intracranial aneurysms (IA) vs. non‐IA (nIA) control specimens. B. For ruptured (RIA) vs. unruptured IA (UIA). For the enhanced list of the functional pathways see the Table S5 in Supporting Information.
