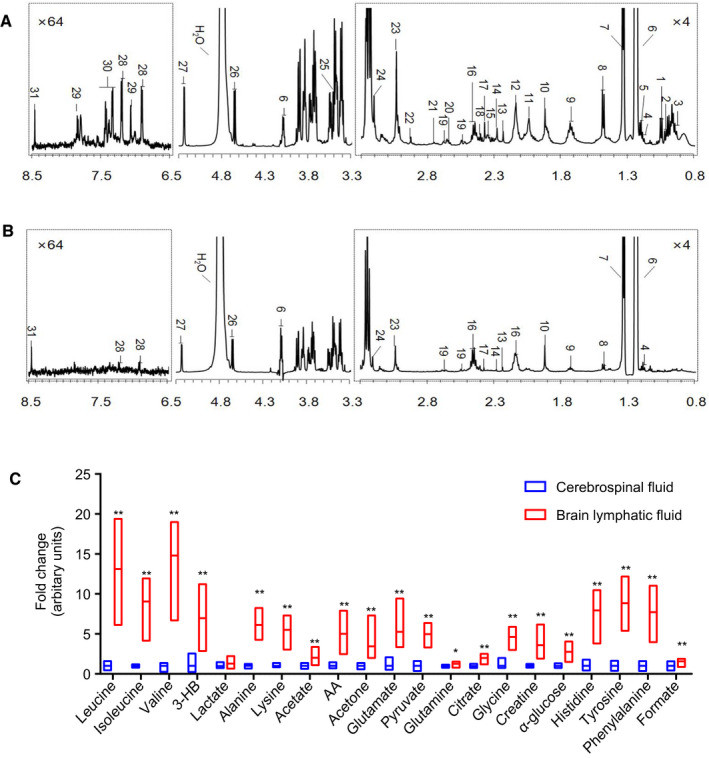
Figure 2.

1H NMR spectra of BLF and CSF from healthy rats, and concentrations of metabolites in BLF and CSF. A, The spectrum of BLF. The spectral regions of δ 0.8‐3.3 and δ 6.5‐8.5 were amplified 4 and 64 times, respectively, compared with the region of δ 3.3‐5.3. A total of 31 metabolites were identified from the NMR spectra in BLF. (n = 8). B, The spectrum of CSF. A total of 21 metabolites were detected in CSF. Metabolite keys are listed in Table S1. (n = 9). C, The relative concentration difference in metabolites between BLF and CSF from healthy rats, suggesting that BLF was enriched with more metabolites. Student's t‐test was used to evaluate the significance of difference in metabolites between CSF (n = 9) and BLF (n = 8). *P < 0.05, **P < 0.01.
