Figure 3.

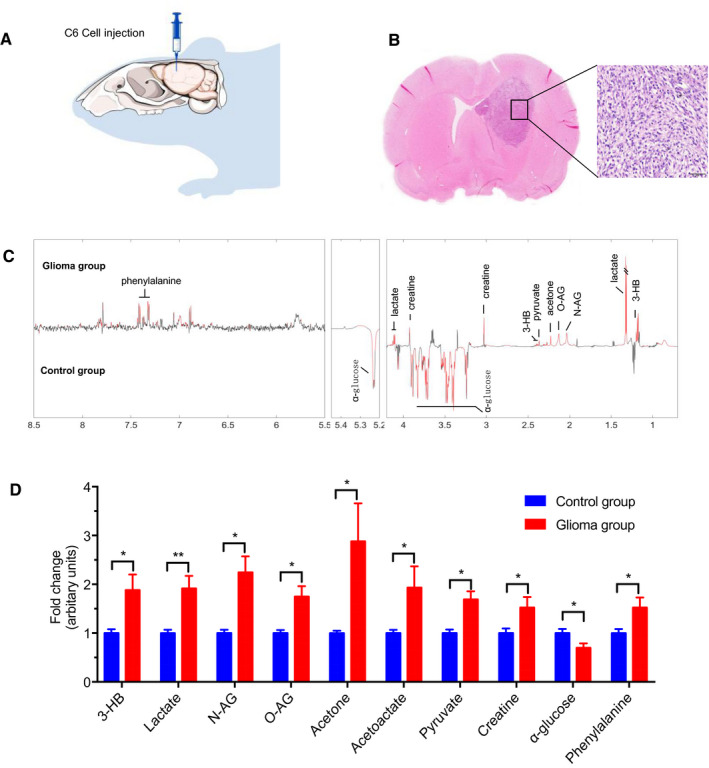
Brain morphologic changes and BLF metabolome fluctuations under glioma conditions. A, Injection of C6 glioma cells in the right striatum. (n = 8). B, Twenty‐two days after the injection, glioma tissue was found in the striatum with a number of glioma cells and lymphatic cells. Bar: 50 μm. C, Differential‐metabograms of BLF from control rats (n = 8) and glioma rats (n = 8). Metabolites with red color are significantly changed between groups. Multiple univariate data analysis (MUDA) was used to evaluate the significance of difference in metabolite concentrations between groups. D, Relative concentrations of ten metabolites (3‐hydroxybutyrate (3‐HB), lactate, N‐acetyl‐glycoprotein (N‐AG), O‐acetylglycoprotein (O‐AG), acetone, acetoacetate (AA), pyruvate, creatine, α‐glucose, and phenylalanine) showing significant differences between glioma BLF samples and control samples. Student's t‐test was used to evaluate the significance of difference in metabolites between two groups of samples. *P < 0.05, **P < 0.01.
