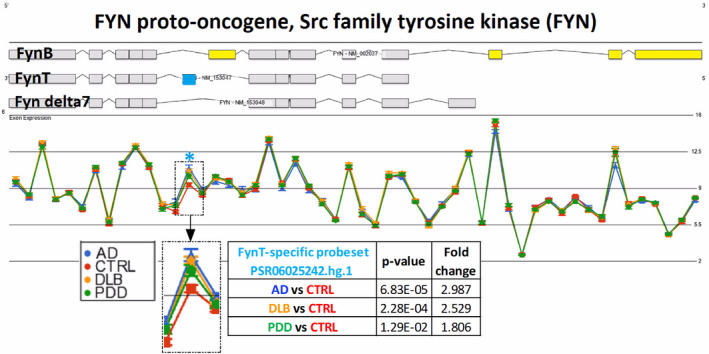
FIGURE 1.

Specific upregulation of FynT isoform expression in prefrontal cortex of AD and LBD. Gene View plot demonstrates differential alternative splicing of Fyn in BA9 samples of CTRL (n = 9, red), AD (n = 9, blue), DLB (n = 12, amber), and PDD (n = 12, green), from data derived from Affymetrix HTA array. Light blue asterisk indicated the PSR06025242.hg.1 probeset, with a magnified view shown in the inset, corresponding to the FynT‐specific exon highlighted in blue. FynB‐specific exons are highlighted in yellow. The Y‐axis is in Log2 scale intensity value. The p values shown are of Alt‐splicing ANOVAs using the Partek Genomic Suite® software
