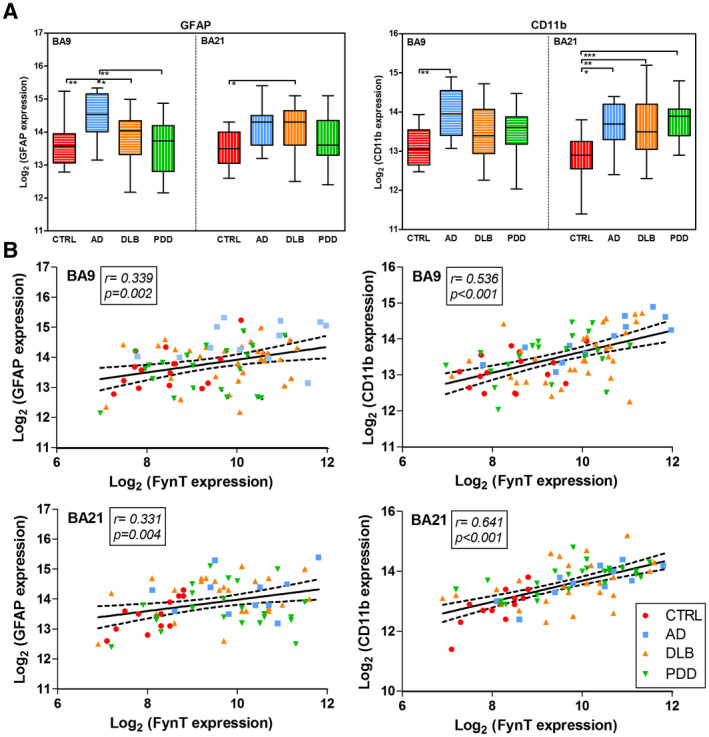
FIGURE 4.

Association of FynT expression with neuroinflammatory markers in CTRL, AD, and LBD. (A) Gene expression of GFAP astrocytic marker (left) and CD11b microglial marker (right) were determined by real‐time RT‐PCR in BA9 and BA21, derived from CTRL (n = 13–15, red), AD (n = 11–12, blue), DLB (n = 25–31, amber), and PDD (n = 14–21, green). Data were Log2 transformed and depicted as box plots, with the horizontal intersecting lines and borders indicating median and interquartile range for each group, while whiskers show the highest and lowest values not considered outliers. (B) Scatter plots of Log2‐transforemd FynT expression against GFAP (left) and CD11b (right) in BA9 (top) and BA21 (bottom) of the combined cohort. Solid lines indicated linear regressed best‐fit curves while dashed lines indicated their respective 95% confidence intervals, with insets showing Pearson's correlation coefficients (r) and their respective p values. *p < 0.05, **p < 0.01, ***p < 0.001, significant pairwise differences between diagnostic groups by one‐way ANOVA with post hoc Bonferroni's tests
