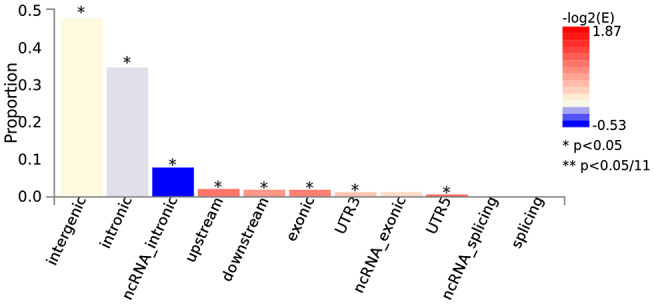
Figure 2.

Functional consequences of SNPs on genes for the GWAS by Jansen et al (14). The histogram displays the proportion of SNPs (all SNPs in LD with independent significant SNPs) which have corresponding functional annotation assigned by ANNOVAR. Bars are colored by log2 (enrichment) relative to all SNPs in the selected reference panel. Plots are made with FUMA (25) using data described in “Data Availability Statement” section. For equivalent results of the GWAS by Kunkle et al (16) see Figure S3.
