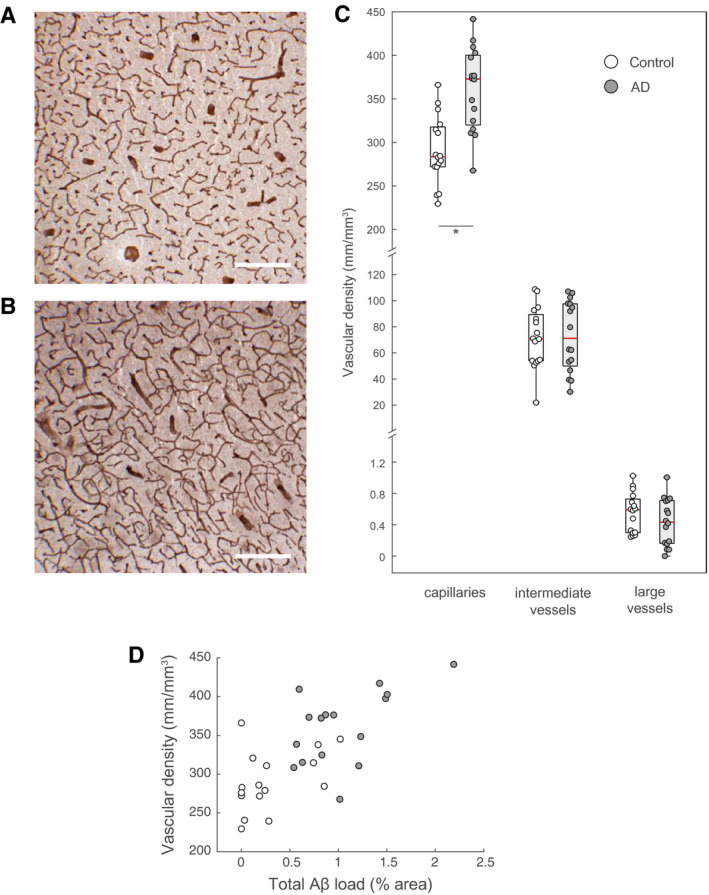
Figure 3.

Vascular density changes in AD. A and B. Representative immunohistochemical stains for laminin showing changes in capillary density in a non‐demented control (A) versus an AD case (B). The discontinuous pattern of staining is owed to the sectioning of fresh‐frozen samples. C. The density of capillaries (defined as vessels with diameters ≤9 µm) is significantly increased in AD cases compared to controls (*P = 0.000079, one‐way ANOVA). The density of intermediate and large vessels (including arterioles and veins) remains constant (P = 0.9 and 0.24, respectively; one‐way ANOVA). D. Vascular density correlated with the total Aβ load (r s = 0.6419, P = 0.000075, Spearman's rank‐order correlation). Scale bars: 250 µm.
