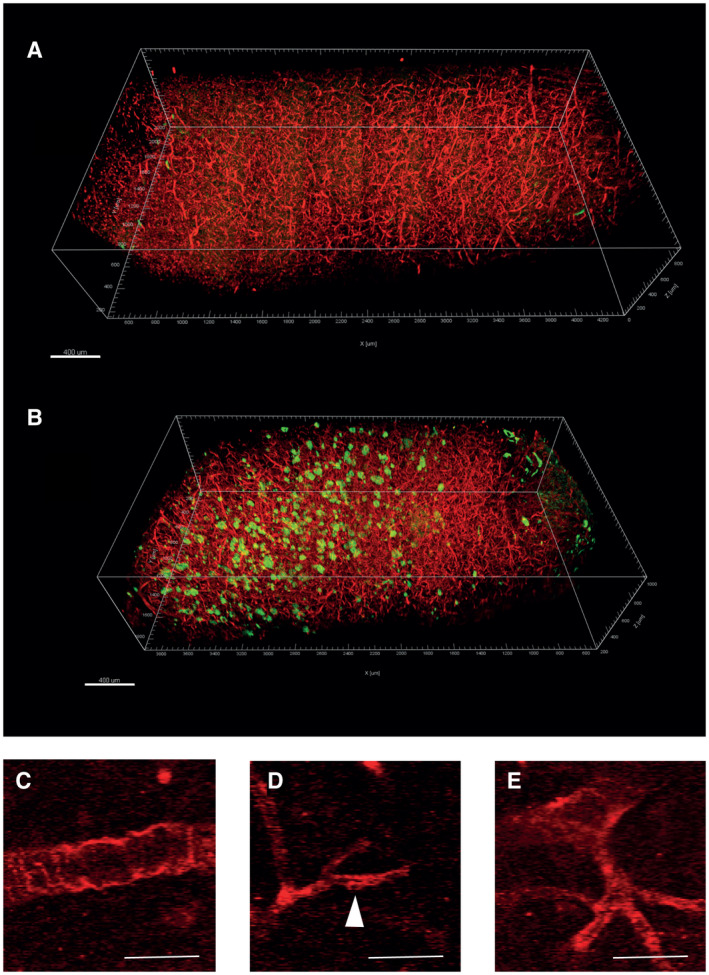
Figure 4.

Pericyte vascular network in cleared brain samples. A and B. 3D‐rendering of stitched and processed two‐photon images from two cleared specimens, one non‐demented control case (A) and one AD case (B) showing PDGFRβ‐immunoreactive (red) and Aβ‐immunoreactive (green) signals. The spurious green signal in the surface of A represent contaminating particles of the tissue piece. The density of PDGFRβ‐immunoreactive structures is similar between the control and AD tissue. C–E. raw scanning images of the signal corresponding to PDGFRβ‐immunoreactivity. Under the imaging protocol employed for the sampling of large tissue volumes, two‐photon imaging did not resolve the fine cellular structures of pericytes. However, the staining revealed unambiguously the lining of PDGFRβ‐immunoreactive mural cells in arterioles, capillaries and venules. Scale bars: 400 µm.
