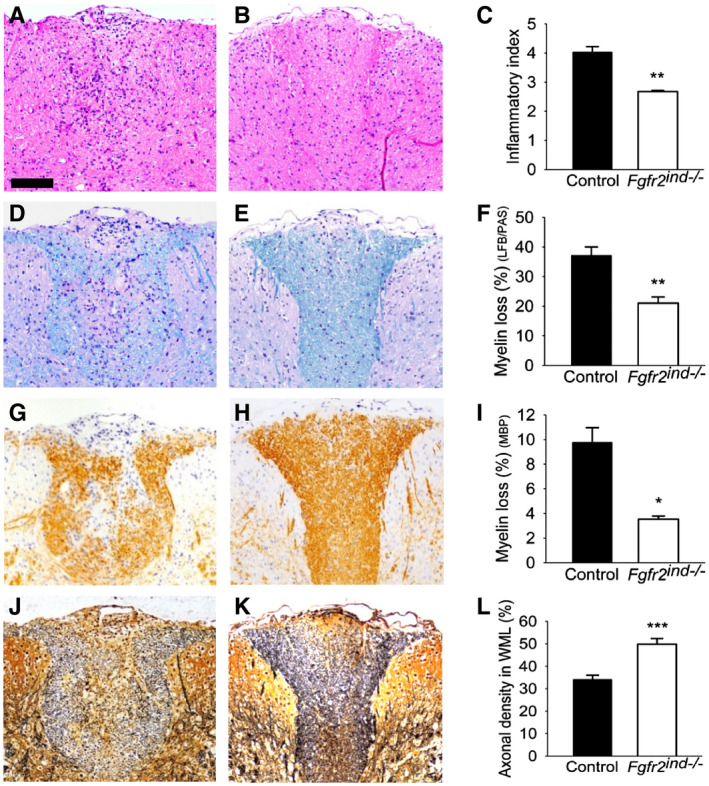
FIGURE 3.

Inflammation, myelin loss and axonal density in the chronic phase of EAE. Representative images of spinal cord white matter lesions are shown for controls (A, D, G, J) and Fgfr2ind −/− mice (B, E, H, K). Fgfr2ind −/− mice showed a lower inflammatory index compared with control mice (A–C). The degree of myelin loss (LFB/PAS staining) (D–F) and loss of myelin basic protein (MBP staining) (G–I) was less pronounced in Fgfr2ind −/− mice. Axonal density was higher in Fgfr2ind −/− mice (J–L). n = 5, data are presented as mean ±SEM. *p < 0.05; **p < 0.005; ***p < 0.001. Bar: 100 µm.
